The Hitchhiker's Guide to DeFi Insurance
by Carolina Goldstein, Catarina Urgueira and Tomás Palmeirim • Monday, October 31
2022 • Published at Three Sigma
Introduction
Since the early days, the DeFi market has been severely shaken by hacks, bugs, exploits, rug-pulls, flash
loan attacks, and a long list of attack vectors, causing loss of confidence in its core value
proposition. Insurance solutions that can mitigate the high risk inherent in this industry's innovations
are one of the most important aspects for the widespread adoption of DeFi.
Yield and risk are positively correlated, with higher yields indicating market participants' greater
exposure to risk. DeFi yields are significantly higher than the ones seen in traditional finance,
indicating a greater level of risk. This risk is mainly attributable to the complexity, novelty, and
immutability of DeFi, where bugs or smart contract errors can lead to exploits resulting in colossal
losses, emphasizing the need for insurance solutions in the industry.
Since risk should ideally be measured automatically and in a decentralized manner using solely on-chain
information, developing insurance mechanisms for the DeFi sector is extremely difficult and doesn't
entirely fit with what we see in traditional capital markets. Decentralizing the insurance market has
the potential to transform the claiming process into one that is unbiased, trustless, transparent, and
automated using smart contracts while also providing coverage providers with a return on their capital
and insurers with guarantees about the safety of their assets.
The insured cover types, premium pricing, risk management, and claims process vary according to the
Insurance protocol implementation and strategy. This paper will examine the Ethereum DeFi insurance
sector in depth, examining 12 different protocols, providing a historical review, and comparing their
methodology, business models, and tokenomics.
Insurance Market Overview
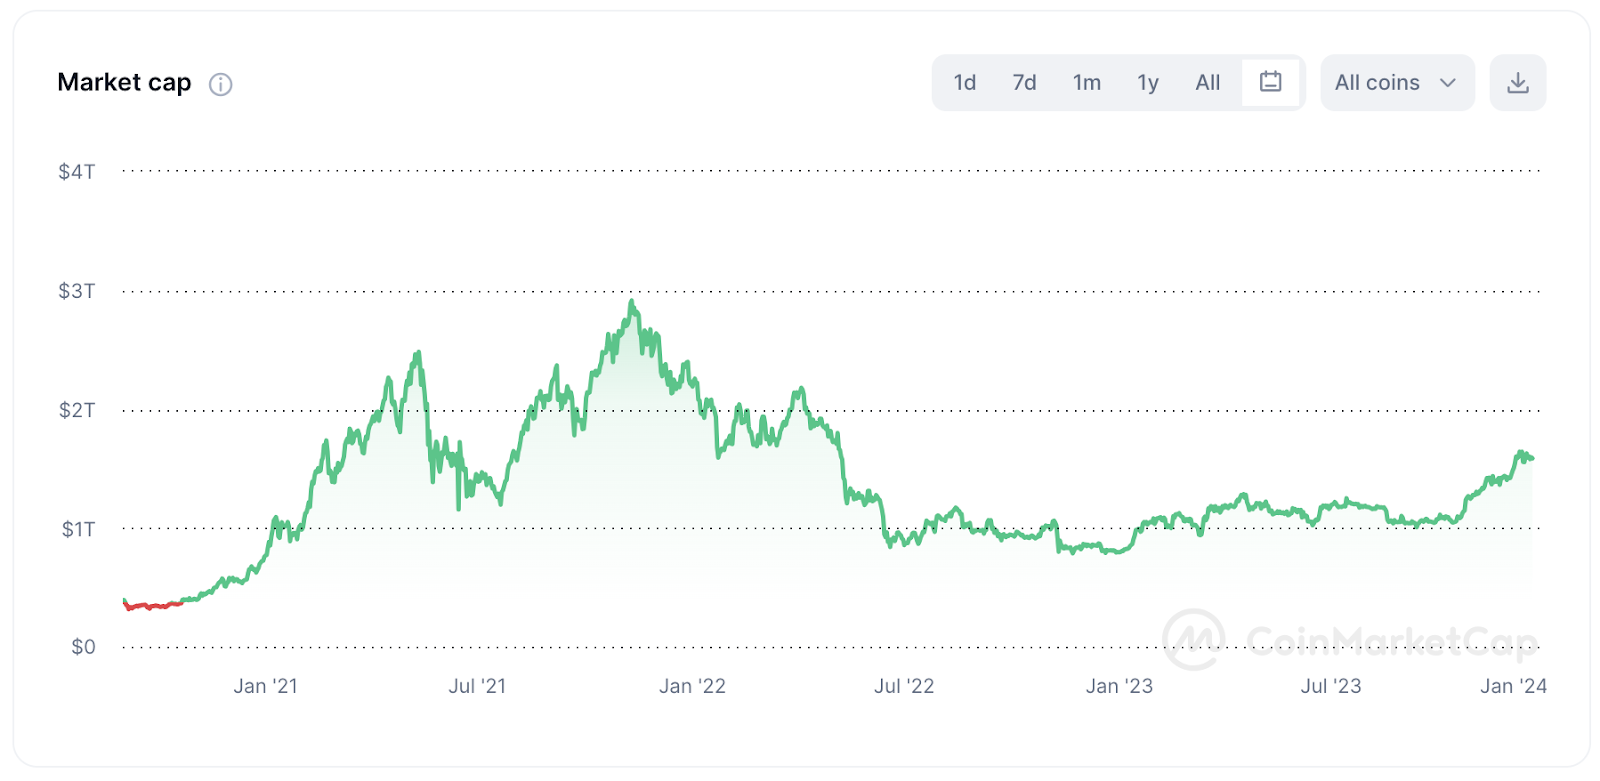
DeFi automates financial services via smart contracts and has 53 billion in total value locked, with an
all-time high of 170 billion in December 2021, with current TVL representing only 31% of the ATH.
(Source: DeFi Llama) The rise in TVL is positive for the industry, but it also increases the possible
damage caused if that value is lost due to smart contract vulnerabilities.
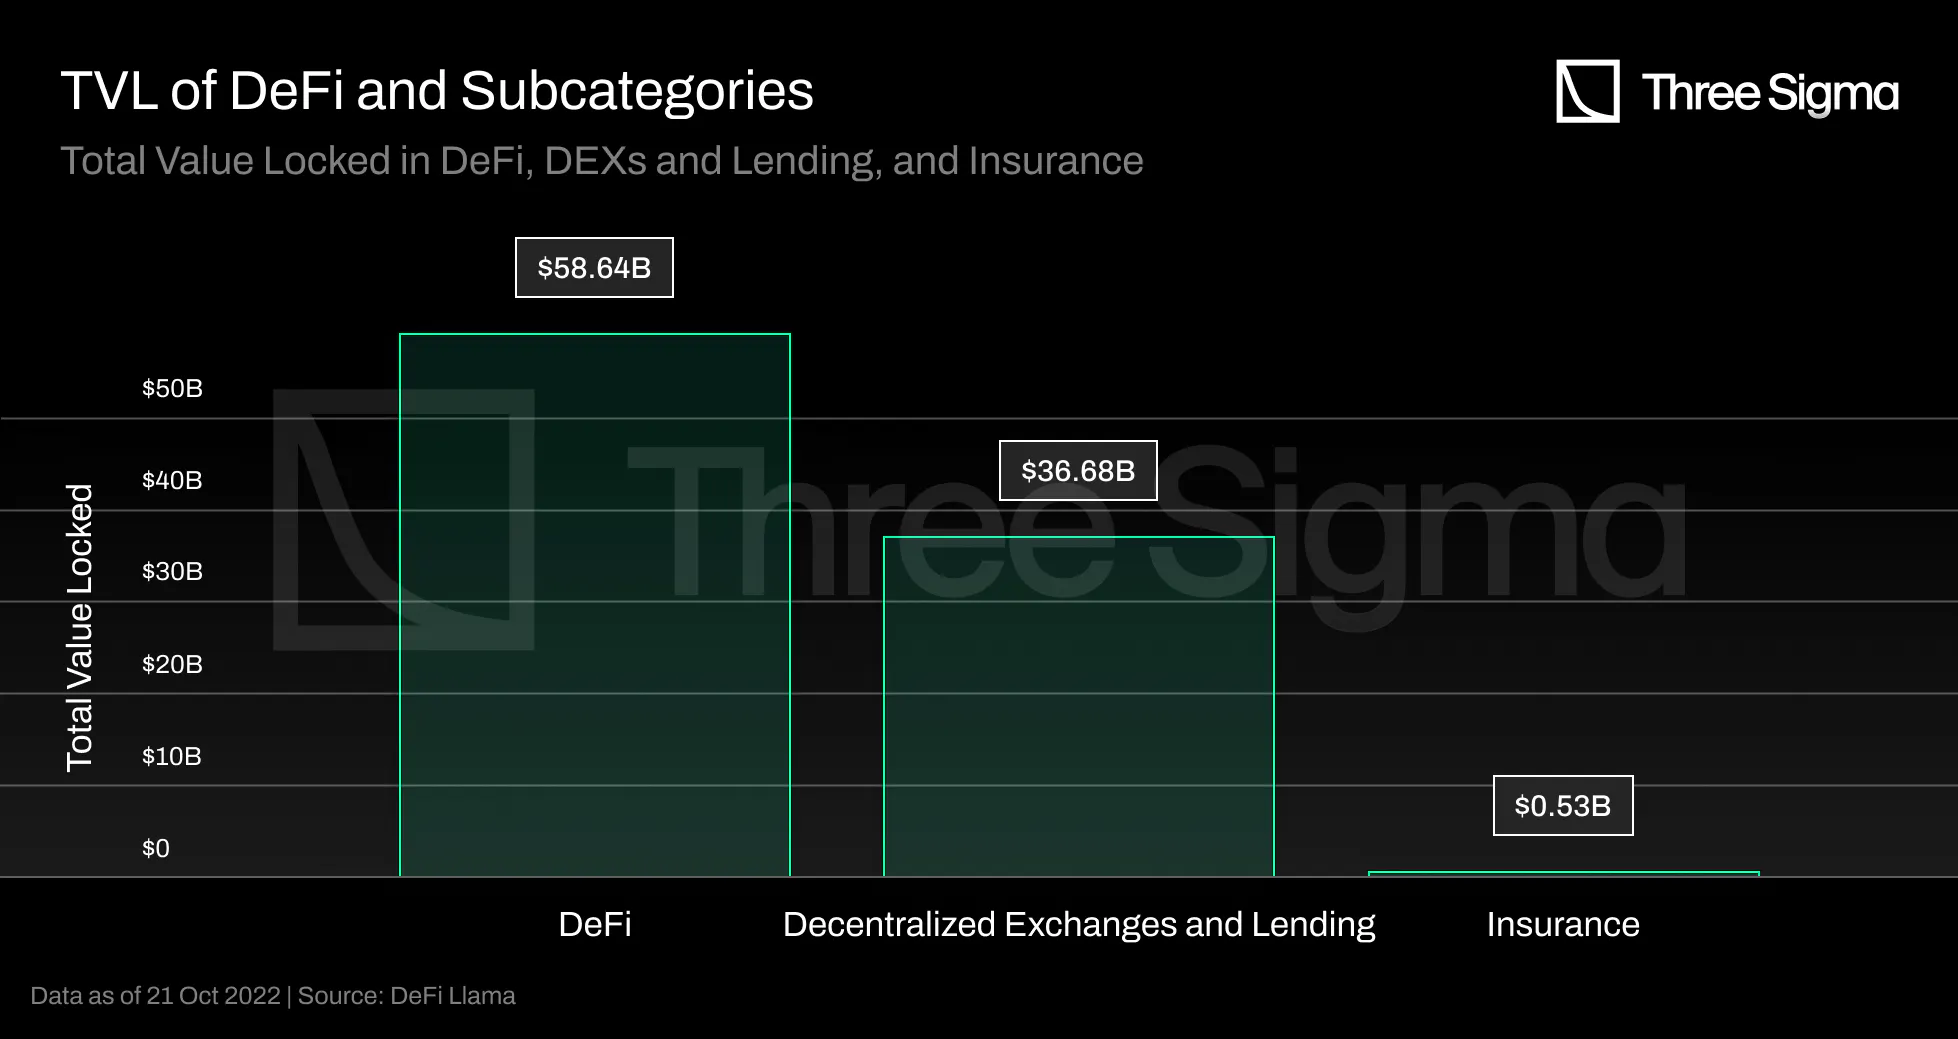
The first wave of innovation in DeFi focused mainly on two fundamental financial primitives:
decentralized exchanges and lending. These two domains account for the vast bulk of the value locked in
DeFi protocols, totalling 36.68 billion dollars in TVL, according to DeFi Llama. In contrast, DeFi
insurance accounts for only 457 million dollars in TVL, despite significant advances in this segment of
the industry. DeFi insurance makes up less than 1% of total TVL in DeFi. Before investing large sums of
money in this market, investors may desire a sense of security, and the entire Web3 economy is currently
underinsured.
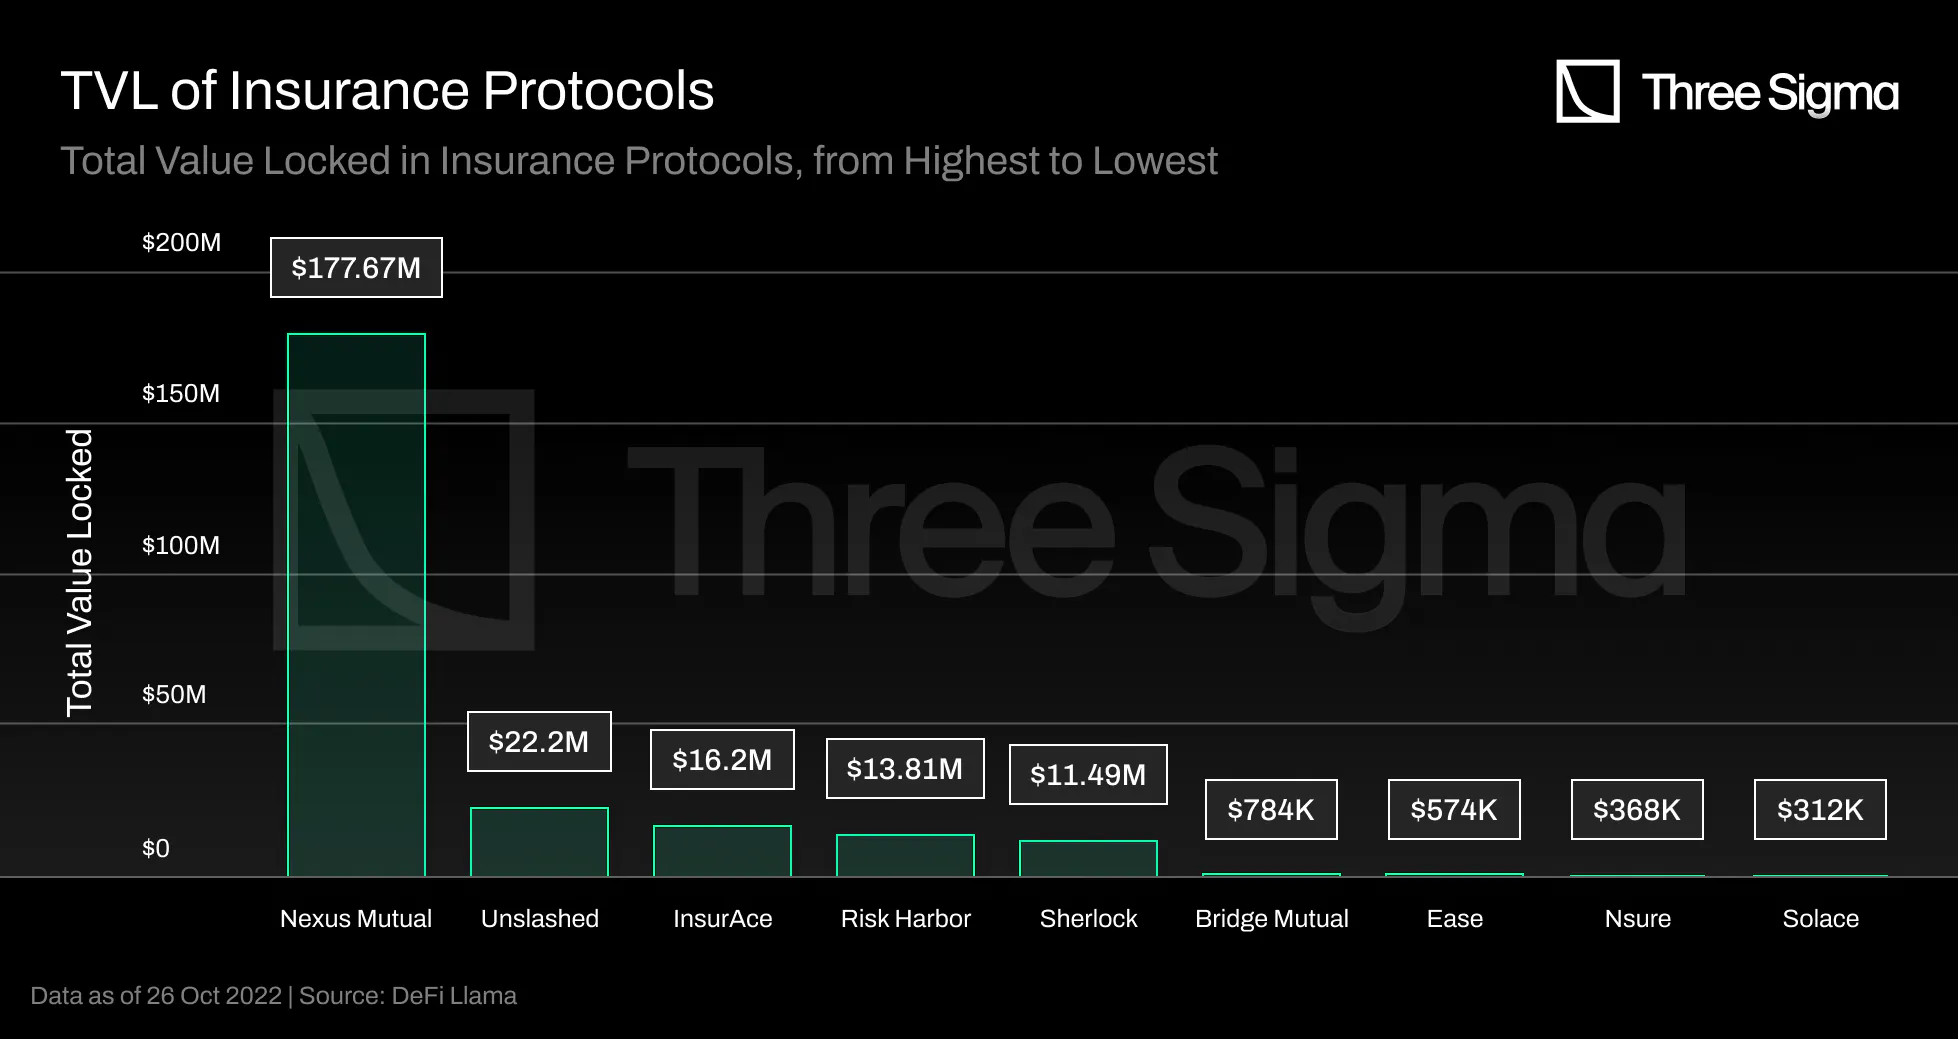
Nexus Mutual, the industry pioneer, dominates the DeFi insurance market since its launch, accounting for
over 68% of the TVL, but it only covers 0.25% of the TVL in DeFi. The remaining insurance market is
still fragmented, with the three protocols listed after Nexus by TVL accounting for roughly 13% of the
market.
What would happen if insurance coverage grows by 10% or 15%? If 10% of the DeFi TVL was insured, the
total assets covered would be $5 billion. The current TVL in insurance is nowhere near one billion
dollars. A significant increase in DeFi insurance TVL is required to cover 10% of DeFi TVL. Developing a
decentralized insurance protocol is substantially complex, and solutions require further work to
increase covered value in DeFi.
How does DeFi Insurance work?
Insurance represents a contract or policy where an individual or entity receives financial protection or
payment from an insurer in the event of a loss.
Insurance companies’ business strategies rely on diversifying risk, and these businesses usually generate
revenue in two ways: by charging premiums and by reinvesting them. Each policy has a premium based on
its risk and after it is sold the insurance firm traditionally invests it in safe short-term
interest-bearing assets to avoid insolvency.
The global traditional insurance market was valued at more than \$5.3 trillion in 2021. It is expected to
grow by approximately 10.4% to \$5.9 trillion in 2022 and \$8.3 trillion in 2026 at a compound annual
growth rate (CAGR) of 9.1%. (source: PR Newswire) DeFi insurance represents a significant growth
opportunity in the blockchain industry, as its ATH in November 2021 was $1.82 billion, accounting for
only 0.03% of the total traditional global market for 2021.
This global insurance market forecast can predict a reasonable coverable value in DeFi. If only 5% of the
traditional global insurance market becomes the coverable value in DeFi insurance, this equals \$265
billion. Assuming that 15% of the coverable value is insured, we have $39.75 billion in active premium
coverage, significantly more than the current TVL in DeFi insurance and even more than the entire
insured value in DeFi.
In the same way as in traditional insurance companies, DeFi insurance protocols can also carefully invest
their users' capital in other DeFi products to generate more revenue. Generally, if a company
efficiently prices its risk, it should generate more income in premiums than it spends on conditional
payouts.
Instead of purchasing coverage from a centralized entity, DeFi insurance protocols allow users and
companies to purchase coverage from a decentralized pool of coverage providers. Anyone can be a coverage
provider by locking capital in a capital pool and exposing themselves to risk, just as liquidity
providers do in lending protocols. Cover providers invest their funds in pools with higher returns
relative to the protocol's risk, which means that individuals trade the outcomes of events based on
their estimations of the probability of the underlying risk event. If a protocol covered by the insurer
suffers an adverse event such as a hack, the funds in the capital pool that covers that protocol will be
used to compensate users who purchased coverage against that specific event on that protocol. Coverage
providers are incentivized to provide liquidity and are rewarded for assuming risk by earning a return
on their capital. The yield is a percentage of premiums paid, presenting a correlation between the
premium paid and the risk for the protocol under consideration. However, DeFi insurers often include
their own liquidity mining incentives in their yield calculation, which are used to bootstrap liquidity
for the pools.
Our DeFi Insurance thesis is that as the total value locked in DeFi grows, so does the need to secure
that value. With the TVL growing, users must have access to solutions that protect their capital. This
is especially true as institutional players enter the market, since insurance is already a big part of
traditional financial markets.
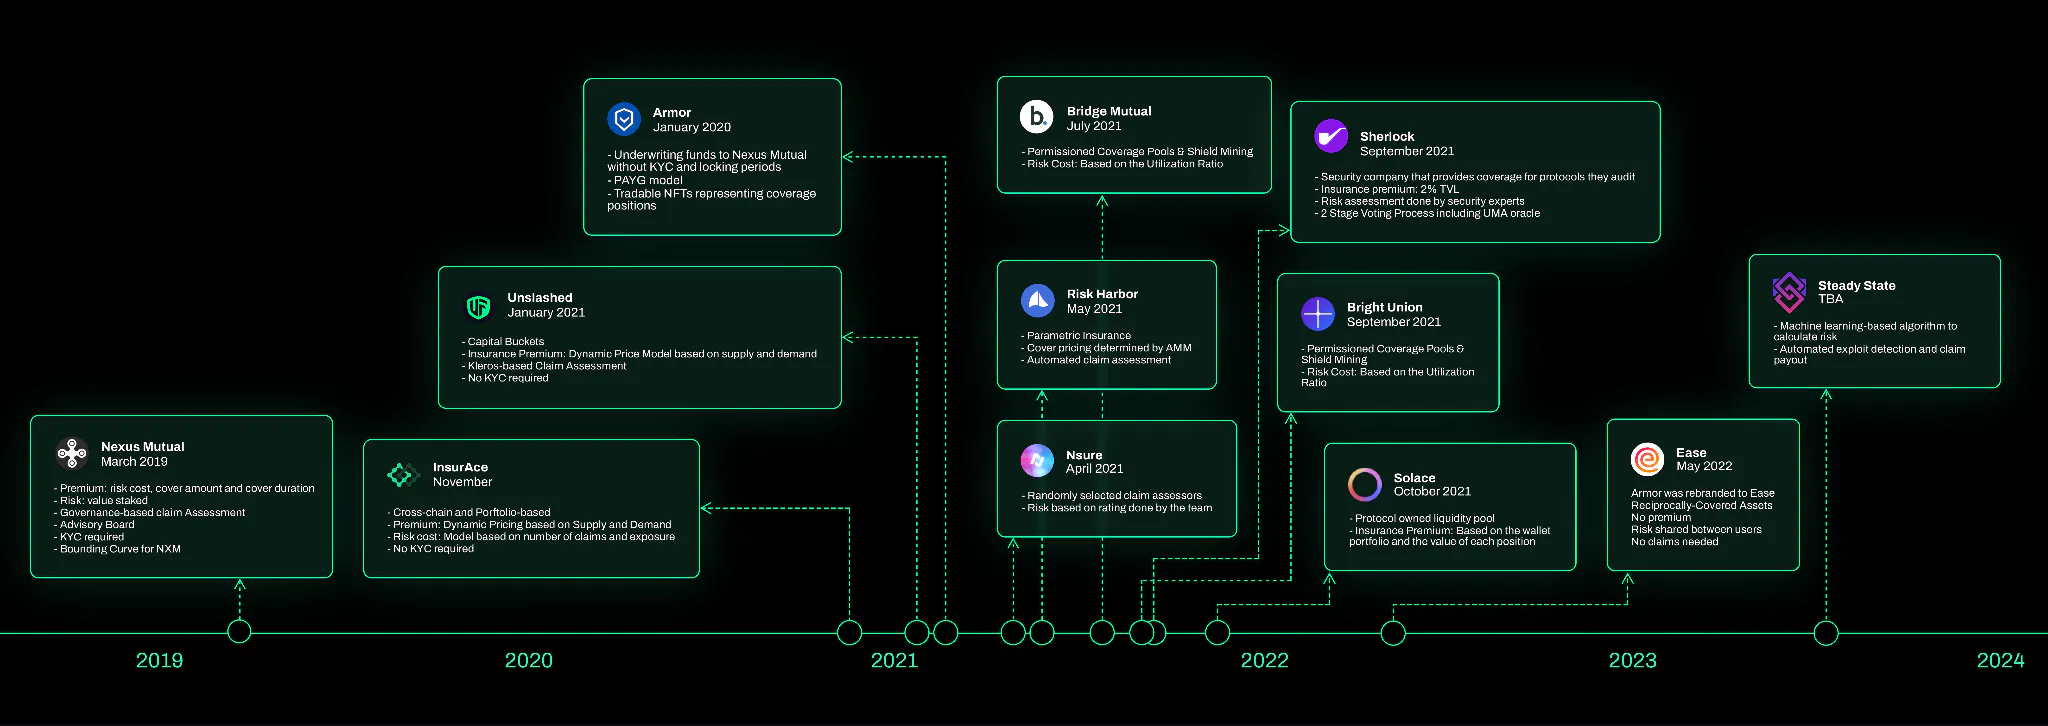
Nexus Mutual was the first insurance protocol in the DeFi industry. Following it, many protocols were
launched in an attempt to solve some of the ongoing challenges in this space. In the next sections, we
will describe how 12 protocols are attempting to solve some existing challenges in decentralized
insurance, as well as provide our inputs on some of the approaches used.
Nexus Mutual
Nexus Mutual launched on Ethereum on May 30th, 2019 as a combination of smart contract code and a fully
compliant legal entity based in the UK operating under a discretionary mutual structure, meaning that
all claims are paid depending on a decision made by the Board, in this case, the Nexus Mutual members.
A discretionary mutual is not an insurance provider but a legal structure that allows members to trade
under the umbrella of a single legal personality. This enables Nexus to disregard all regulatory and
legal requirements that exist for insurance companies. This discretionary mutual allows legal trade in
the UK, but coverage is available globally, with some countries restricted due to local laws. Anyone who
wants to join the mutual in any capacity must go through KYC to ensure compliance, and the membership
rights are represented by their native token NXM. This KYC procedure can give institutional users
greater regulatory confidence.
Nexus Mutual's first product was Smart Contract Cover, the first insurance product that let users protect
themselves from smart contract risks on major DeFi protocols.
In January 2021, Nexus Mutual expanded cover protection to other chains such as BNB, Polkadot, and
Cosmos, as well as added protection for centralized platforms such as Coinbase and Binance and lending
services such as BlockFi and Hodlnaut.
In April 2021, Nexus Mutual added Protocol Cover, given the ever-evolving scope of DeFi attacks. This
broad and versatile protection protects members from smart contract hacks, oracle attacks, severe
economic attacks, governance attacks, layer two components, and protocols on any chain.
In July 2021, Nexus Mutual added Yield Token Cover, which provides coverage against the full range of
risks to which a protocol, or combination of protocols, LP position is exposed to. This covers smart
contract risk, oracle failure or manipulation, stablecoin de-pegs, governance attacks, and any other
threat that leads to the protocol losing value, provided it has an LP token representing consumer
deposits.
The vast majority of Nexus covers protect users against protocols, accounting for more than 80% of total
covers, followed by custodian protection (a little more than 10%) and yield tokens coverage.
Nexus Mutual gain market fit when attracting huge amount of TVL in the first months. It is still the
largest insurance protocol in terms of TVL but since mid-2021, Nexus Mutual's written premium,
denominated in US dollars, has declined. This could be because new insurance protocols are taking market
share from existing protocols, such as Unslashed and InsurAce, since they can provide more economic
incentives to users by distributing governance tokens and do not require a KYC process. Other external
macro conditions could also have influenced this outcome, which will be further analyzed when other
insurance protocols are presented.
Nexus Participants
Nexus Mutual members can buy insurance coverage using NXM, provide liquidity to the capital pool as Cover
Providers and/or vote in the claiming process as Claim Assessors. A small membership fee of 0.002 ETH is
charged to all members.
Cover Providers are Nexus Mutual members who stake NXM against protocols or centralized exchanges to
underwrite insurance and earn 50% of newly minted NXM insurance premiums. Minting NXM requires the
addition of ETH to the Capital Pool, which is currently funded by premiums pouring into the pool. This
mechanism exists due to the existing bonding curve, which was once the primary trading place for NXM. As
a result, the circulating supply of NXM increases, but so does the value of the Capital Pool. Cover
Providers are, therefore, only exposed to protocol-specific risks. The rewards are proportional to the
amount of capital the cover provider has locked into the pool. Staking does not generate rewards on its
own; covers must be purchased for stakers to receive rewards (50% of the premiums) and the protocol to
generate revenue.
On the other hand, Claim Assessors are members who stake NXM to evaluate claims submitted by other
members and receive rewards for voting in conformity with the consensus.
Claim Assessment
Nexus Mutual is implementing a three-step governance-based approach to claims assessment. In a
governance-based design, token-holding claim assessors vote on claim decisions. To submit a claim, the
member must stake 5% of the purchasing cover in NXM tokens. This deposit is returned to the member if
the claim is approved; otherwise, the tokens are destroyed. After submitting a claim, assessors must
vote to approve or deny the claim based on the submitted cover proof. If the claim is approved, cover
providers on that pool will have their stakes reduced proportionally to the claim amount. If the stakes
are insufficient to cover the claim amount, Mutual will assume the loss by reducing all of its stakes.
Claim assessors must lock their tokens for fourteen days before voting on any claim. This encourages a
fair voting procedure because members cannot vote on their request immediately after submitting a claim.
For a claim to be approved, over 70% of votes must be cast, and the total vote weight must exceed five
times the amount of coverage.
All claims are accessible through the Nexus Mutual application and at the smart contract level. If the
insurer denies valid claims, it is unlikely that new members will join, and existing customers will not
purchase new coverage products.
There are disadvantages to such a mechanism to evaluate claims, such as having a process that requires
manual voting, where members can vote to reject a claim to avoid losing their capital and are
incentivized to vote with the majority rather than using their judgment. As seen in the governance of
other DeFi protocols, only some members want to participate in the voting process actively, so the 70%
of votes necessary for a claim to be approved can be challenging to achieve.
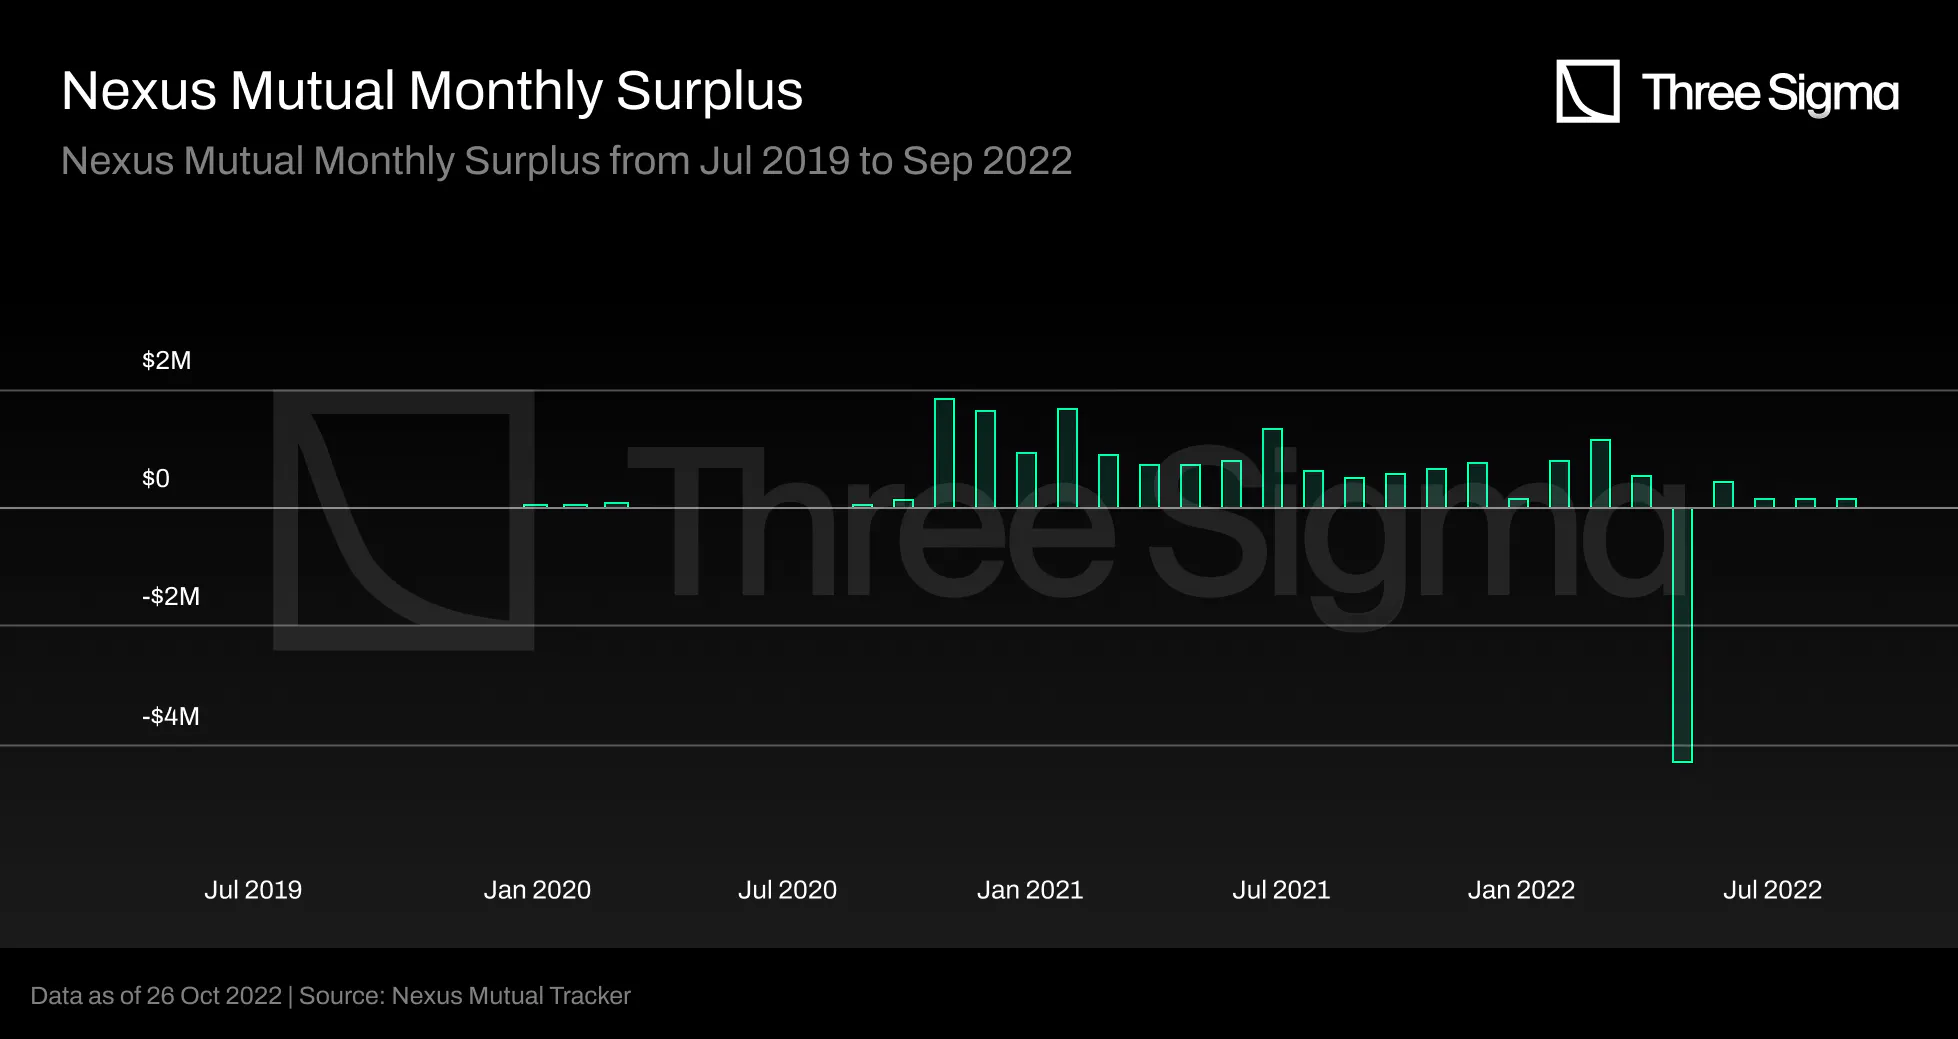
The claim payouts in 2022 were mainly caused by the Rari Capital Fuse Market Exploit due to a reentrancy
vulnerability, and the Perpetual Protocol v1 economic design failure. As shown in the graph below, Rari
Capital paid out 20 ETH and 5,008,000 DAI in April, representing a massive decline in monthly surplus.
Nexus Mutual did not pay a single claim related to UST de-peg and Anchor Protocol because the coverage
provided was limited to issues regarding the smart contract and did not include UST de-peg.
DeFi incidents require expertise and on-chain data analysis to determine if the insurance policy covers
the incident and if the member's wallet submitting the claim was affected. It can be tough for regular
users to vote wisely on this. The Advisory Board of Nexus Mutual comprises insurance experts with the
necessary expertise to conduct this investigation, which is shared with the community before voting in
the form of an investigation summary.
Premium Pricing
Nexus Mutual uses a market-based risk pricing mechanism. Risk is determined by combining a base risk
calculation, which is computed using actuarial math, with the total value staked. Essentially, cover
providers stake NXM against insurance taken out on a specific protocol to demonstrate their confidence
in the protocol's safety. A more significant amount of staked NXM indicates that after risk assessment,
cover providers feel comfortable depositing funds in that pool, resulting in a lower risk cost and lower
premium for that pool.
In that sense, the premium is entirely driven by the amount of NXM staked by Risk Assessors against each
protocol and custodian. More specifically, the pricing formula for each cover is calculated as follows:
$$Cover\ price\ = \ risk\ cost\ *\ (1 + surplus\ margin)\ *\ \frac{cover\ period}{365.25}\ *\ cover\
amount$$
where the risk cost is calculated automatically based on the value staked against the protocol or
custodian, in a way that the more value staked, the lower the annual cost of coverage. The surplus
margin is a parameter introduced to enable costs (i.e. claim assessor and cover provider rewards) and
generate protocol revenue. It is currently set at 30%. A strong assumption is made here, which is the
basis for the whole pricing system: cover providers stake more money in protocols they consider safer
and believe they will not have to pay out. From this, follows that pools with more value staked need to
charge a smaller premium. However, the incentives for capital providers to stake in a certain pool are
tightly associated with the APY they are expected to receive, which could cloud their judgment regarding
risk assessment. Hence, the question is raised as to whether the value staked against a certain protocol
is, when considered as the sole metric, sufficient for measuring risk.
The inputs for calculating the risk cost include: the net staked NXM, defined as the amount of NXM staked
subtracted by 50% of the pending staking withdrawals, a maximum risk cost, which is set at 100%, a
minimum risk cost set at 2%, and low risk cost limit, which is the amount of stake required to reach the
low risk cost, set at 50,000 NXM. Given these inputs the risk cost is calculated as follows:
$$Risk\ cost\ = \ 1\ - \ (\frac{\text{net staked NXM}}{\text{low risk cost limit}})^{1/7}$$
subject to the risk cost being greater than or equal to the minimum risk cost (2%) and less than or equal
to the maximum risk cost (100%).
It is important to notice that there are capacity limits on the amount of cover that is offered for
specific risks, protecting the protocol from being too exposed to risks. There is a Specific Risk Limit
that varies with the amount of staking on a particular risk and a Global Capacity based on the total
resources of the mutual. The Specific Risk Limit is calculated as the capacity factor times the net
staked NXM (defined above). These capacity factors can be updated by governance. At time of writing,
capacity factors for all covered protocols are equal to 4. The Global Capacity Limit is calculated as
20% of the Minimum Capital Requirement (in ETH terms). A further explanation on how these values were
derived could not be found.
Minimum Capital Requirement
The Minimum Capital Requirement (MCR) is an important component of the Nexus Mutual system, as it is used
directly in the NXM price formula. It represents the minimum amount of funds the mutual needs to be very
confident it can pay all claims and is calculated as follows:
$$MCR = max(MCR Floor, f(Cover Amount))$$
The idea behind this formula is that f(Cover Amount) determines the MCR, however, especially in the
beginning, the mutual sets a MCR Floor value to ensure there is capital to enable cover growth. This was
set at 12,000ETH at launch (May 2019), meaning that the protocol had to gather this amount of ETH before
cover purchases were enabled for the first time. Despite this, the team decided to lower it to 7,000ETH
one month later to be able to start selling cover earlier. A few months later governance voted on the
implementation of a dynamic MCR Floor to better meet concentrated demand on a smaller number of systems.
The incremental rates were tweaked until, in October 2020, it was decided to switch this increase off.
Currently it is 162,424.73 ETH. In May 2021 the capital model floor value was decentralized and MCR
calculations are now fully on-chain. Instead of the MCR being updated manually by the team, it takes the
existing MCR value and moves it towards the target each time someone buys or sells NXM or has a
successful claim. However, the actual MCR is smoothened to avoid large one-off shocks: it is restricted
to move a maximum of 1% in any one update and a maximum of 5% per day. The capital model is currently
implemented by assuming a fixed gearing factor applies to the active cover in ETH terms:
$$f(Cover Amount) = Active Cover in ETH / Gearing Factor$$
If the full Capital Model (off-chain) produces results that are very different, the gearing factor is
updated via governance. The Gearing Factor is currently set at 4.8.
It is the capital model that determines the minimum amount of funds the mutual needs to hold. The MCR is
set using methodology developed by the European Insurance and Occupational Pensions Authority (EIOPA).
The two main considerations that make up the MCR are the Best Estimate Liability (BEL), which represents
the expected loss on each individual cover, and a Buffer, which refers to the funds the pool would
require to survive a black swan event. The BEL for each cover currently corresponds to the entire Risk
Cost to get a more prudent estimation, but should later take into consideration the remaining duration
of the cover.
The Smart Contract Cover Module is based on the exposure Nexus Mutual has to the covers it has written
and is a component of the Buffer. It takes into account the total cover amounts for each individual
protocol and custodian ($CA(i)$), the correlations between each pair of contracts ($Corr(i, j)$) and a
scaling factor (SC) calibrated to make the capital result more comparable to a full Solvency II
calculation. It is calculated as follows:
$$CR_{scc}=SC∗ \sqrt{\sum_{i,j}Corr(i,j)∗CA(i)∗CA(j)}$$
Nexus Mutual holds and invests a Capital Pool of assets in excess of the MCR to back its covers. The
coverage ratio (abbreviated to MCR%) is the ratio between the Capital Pool and the MCR.
Like traditional insurance companies, Nexus Mutual can invest in DeFi protocols using a conservative
investment strategy, such as staking ETH to generate PoS rewards or lending assets on decentralized
collateralised protocols. Nexus Investment posts a proposal for an investment strategy on the forum, and
after community discussion, the proposal is put to a vote.
However, when the Minimum Capital Requirement is reached, capital providers cannot withdraw their
liquidity, which can be a drawdown and a reason for them to be more weary of providing capital in a
protocol.
NXM Pricing and Tokenomics
The NXM token can only be purchased on the Nexus Mutual app, as it isn’t listed on exchanges. It uses a
bonding curve (or continuous token model), meaning that tokens can be purchased at any time at variable
prices. The price correlates with the amount of capital available to the mutual and the capital required
to pay out all claims with a certain probability. The main driver of short-term price movement is the
funding level, which encourages users to buy when funding levels are low. In the long term the capital
required to support covers will rise, reflecting the adoption of the platform. The price (in ETH) is
calculated as follows:
$$T P=A+\frac{M C R}{C} * M C R \%$$
where A and C are constant values that were calibrated at launch (A = 0.01028, C = 5, 800, 000).
These tokens can be used to purchase cover, participate in claims assessment, risk assessment and
governance. The model encourages inflow of funds when required, raising capital as necessary. Since the
MCR% is the ratio between Capital Pool and MCR, when the Capital Pool (which is the Mutual’s current
funding level) decreases, e.g. because a claim was paid, so does the token price to recapitalize the
fund. In the long term it is linked to the adoption of the protocol and not only speculation. Actually,
NXM can only be redeemed for 2.5% below purchase price.
When cover is purchased, 90% of the NXM member tokens are burned and 10% are kept to be used as deposit
when submitting claims or returned to the cover purchaser if no claim is made.
NXM represents ownership of Nexus Mutual’s Capital Pool. Only members of the mutual can buy and sell NXM
in the bonding curve. To become a member, users need to complete a KYC process. There is more recently a
version of the token that does not require KYC, wNXM. This can increase the total number of holders, but
can also decrease the number of members. Members remain the only ones that can maintain price parity,
taking advantage of arbitrage opportunities. wNXM is backed 1:1 with NXM, but as it is traded on
exchanges, it is subject to market forces. However, since December 2020 the MCR% has been under 100%,
which means that redemptions are impossible. While redemptions are not possible, the only way to sell
NXM is to wrap it to wNXM and then sell it on the market. At the time of writing, wNXM is trading at
one-third of the price of NXM. For someone to participate in Nexus Mutual, they have to buy NXM, so to
avoid losing a lot of money when selling it, the only rational option is to buy wNXM on the market and
unwrap it in the platform. Hence the bonding curve is effectively not being used at all. This was
confirmed with the team. wNXM would only be pegged to NXM if MCR > 100%.
There are three sources of value accrual to NXM: cover premiums, redemption fees and investment earnings.
When someone buys coverage, 50% of the premium goes to the Capital Pool without minting new NXM,
benefiting all NXM holders through the increasing of MCR, which increases NXM price if MCR > 100%. 40%
also goes to the Capital Pool, but the corresponding NXM is minted and distributed to stakers. Their
stake is partially or totally burnt if there are valid claims on the contract they staked on. 10% is
kept by the cover holder. The corresponding NXM is minted and locked so that half is burnt if they
decide to submit a claim. If the claim is denied and they wish to re-submit it, the other half is burnt.
If users buy coverage in NXM, 40% go to stakers directly as NXM and 50% accruing to the capital pool is
burnt, so that there is less NXM in circulation, producing the same net effect.
When NXM is sold on the platform, a redemption fee of 2.5% goes into the Capital Pool in the form of ETH.
However, as redemptions have not been available for a long period, this fee is also irrelevant.
It would be in the protocol’s best interest to keep MCR% above 100%. However, this hasn’t been able to
happen since almost the beginning of the protocol, which raises the question of whether there should be
other incentives in place to increase the amount deposited in the Capital Pool. Investment earnings
would also go directly into the Capital Pool, so perhaps there is space for improvement there.
Nexus Tokenomics create a positive loop in which: more insurance policies bought means more demand for
NXM and more revenue for cover providers, incentivizing more NXM staking; more Mutual Members means more
demand for NXM; and a more decentralized mutual leads to more staked value in NXM for claim assessors.
The MCR determined by the Capital Model is calibrated to achieve a 99.5% probability of solvency over 1
year.
The Advisory Board is a central point in Nexus Mutual protocol and comprises only five members. It has
too much power as it has access to an emergency pause function that stops all transactions, can burn
claim assessors staked NXM if they find them fraudulent, and can influence the claim decision.
Adoption and TVL
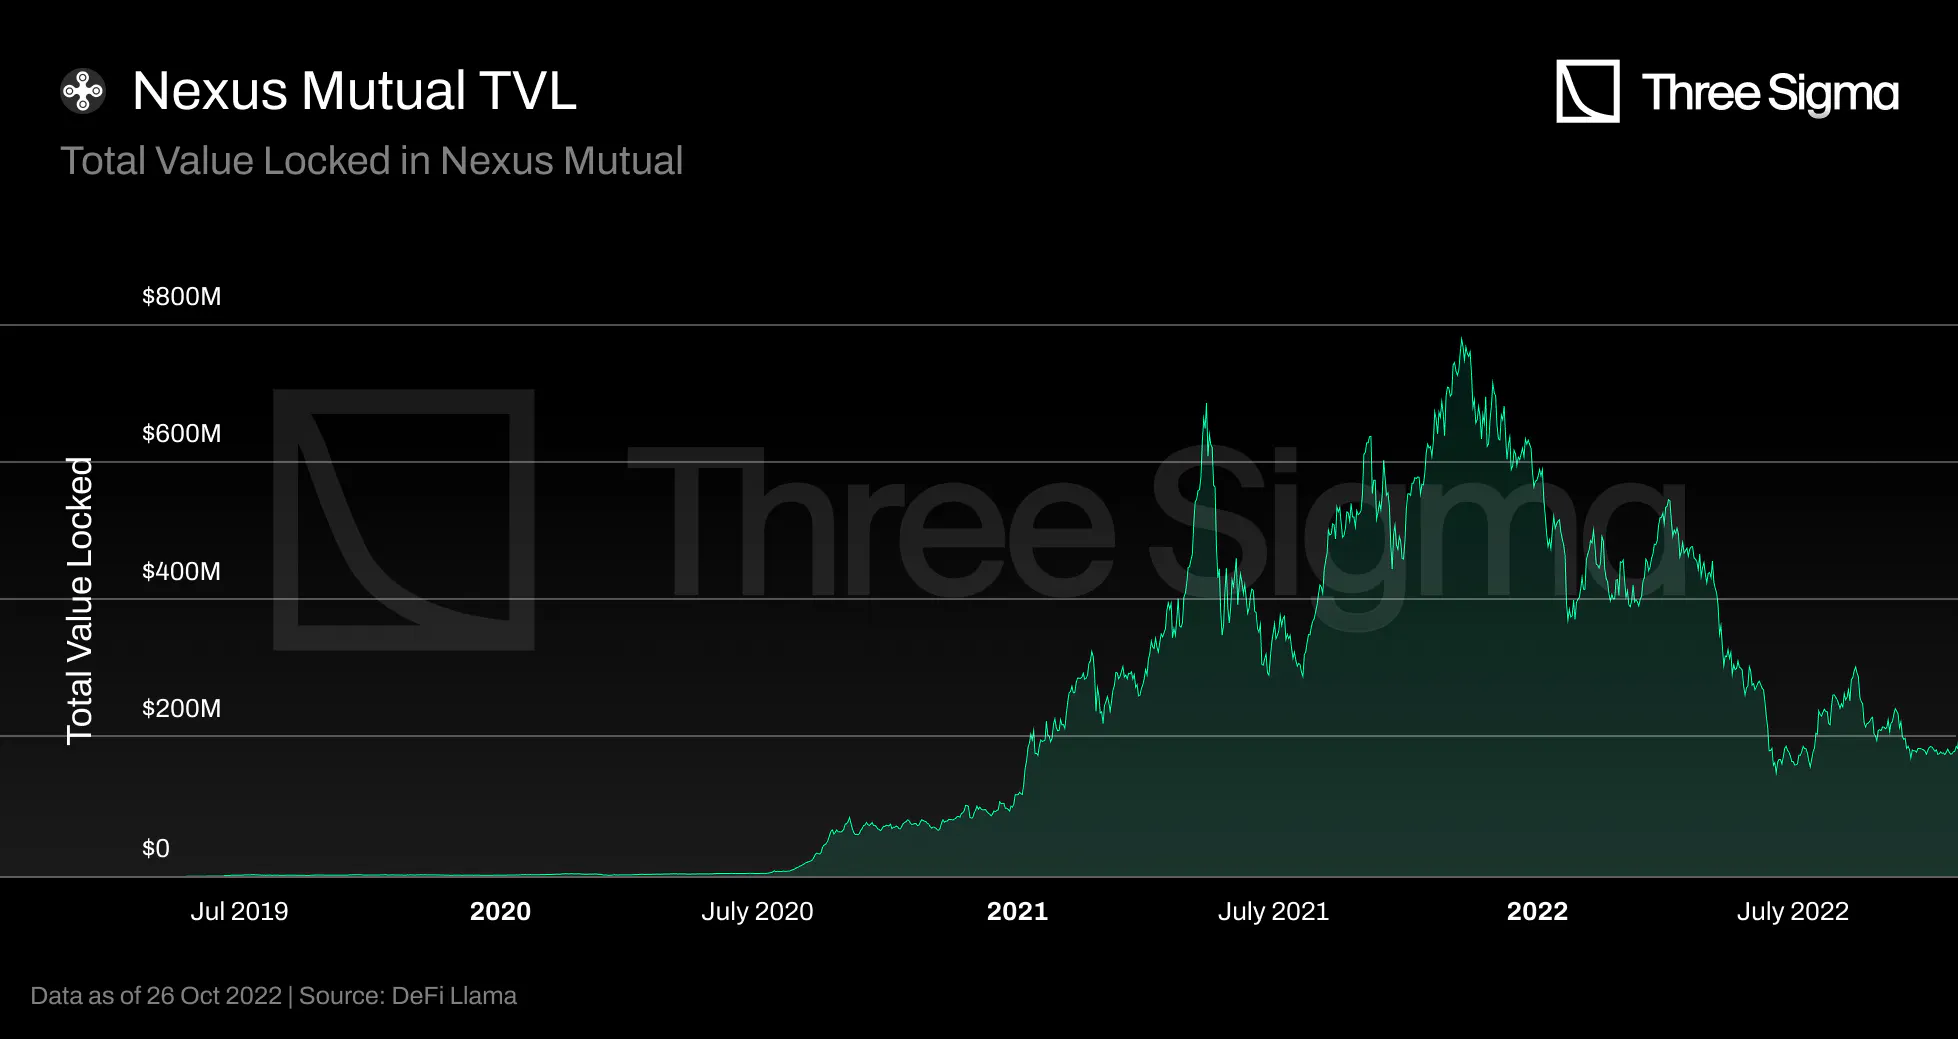
Nexus Mutual's capital pool (TVL) grows whenever a new insurance policy is purchased, investment pools
generate positive income, and NXM is purchased. However, the pool is affected whenever a payout is made,
the Investment Fund incurs a loss, or NXM is burned. The Total Value Locked (TVL) of Nexus Mutual has
grown from \$1.59 million at the start of 2020 to a peak of \$780 million on November 9 2021, an
increase of 490x. However, since then, the broader crypto markets have descended into a bear market
drawdown. Nexus Mutual is no exception, having experienced an approximate 76.5% drawdown to a TVL of
$183 million in October 2022. The value locked in Nexus Mutual represents a negligible portion of the
total unprotected value in the DeFi market, which showcases a massive and risky unprotected value.
When the crypto market is up and at ATH, DeFi protocols have a significant daily volume, are exposed to
more risk, and protection demand may increase. However, if there is less demand for DeFi, there will be
less demand for insurance coverage, resulting in less revenue for insurance providers. With less demand
in the space, TVLs are also affected, and the lower the TVL, the lower the capacity limit to cover
policies. During bear markets, when capital pools generate less revenue, cover providers have fewer
reasons to invest their funds.
TVC
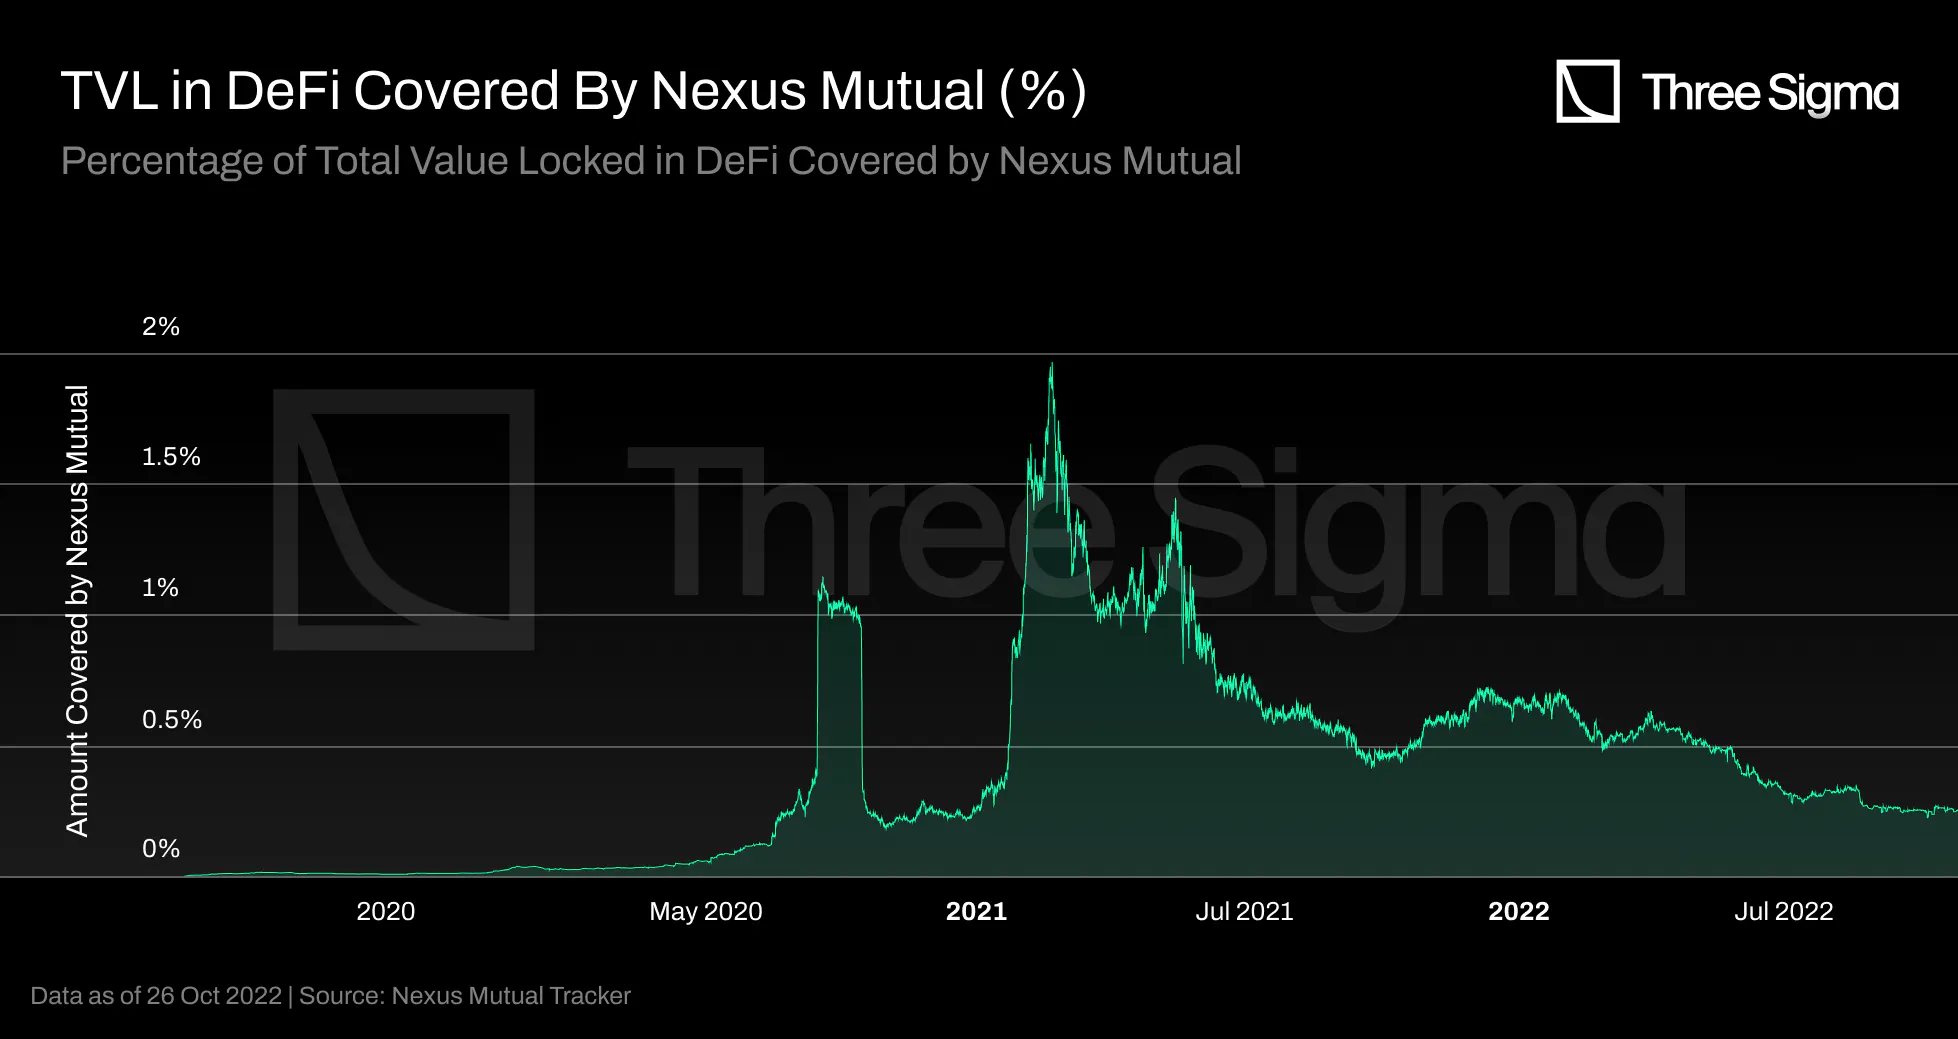
Nexus is the insurance protocol with the higher TVL, however it only accounts for a small portion of
DeFi's TVC. During a bull market with plenty of liquidity in the markets, Nexus' TVC ATH represented
less than 2% of the total DeFi market. These figures indicate a considerable growth possibility for the
decentralized insurance market.
Revenue
Currently, the premium is fully paid when the policy is purchased, and it's a fixed-term amount that the
cover buyer selects. When a user pays for the cover cost, 50% goes to stakers, 10% is held for the
person's cover deposit, and 40% is kept in the capital pool.
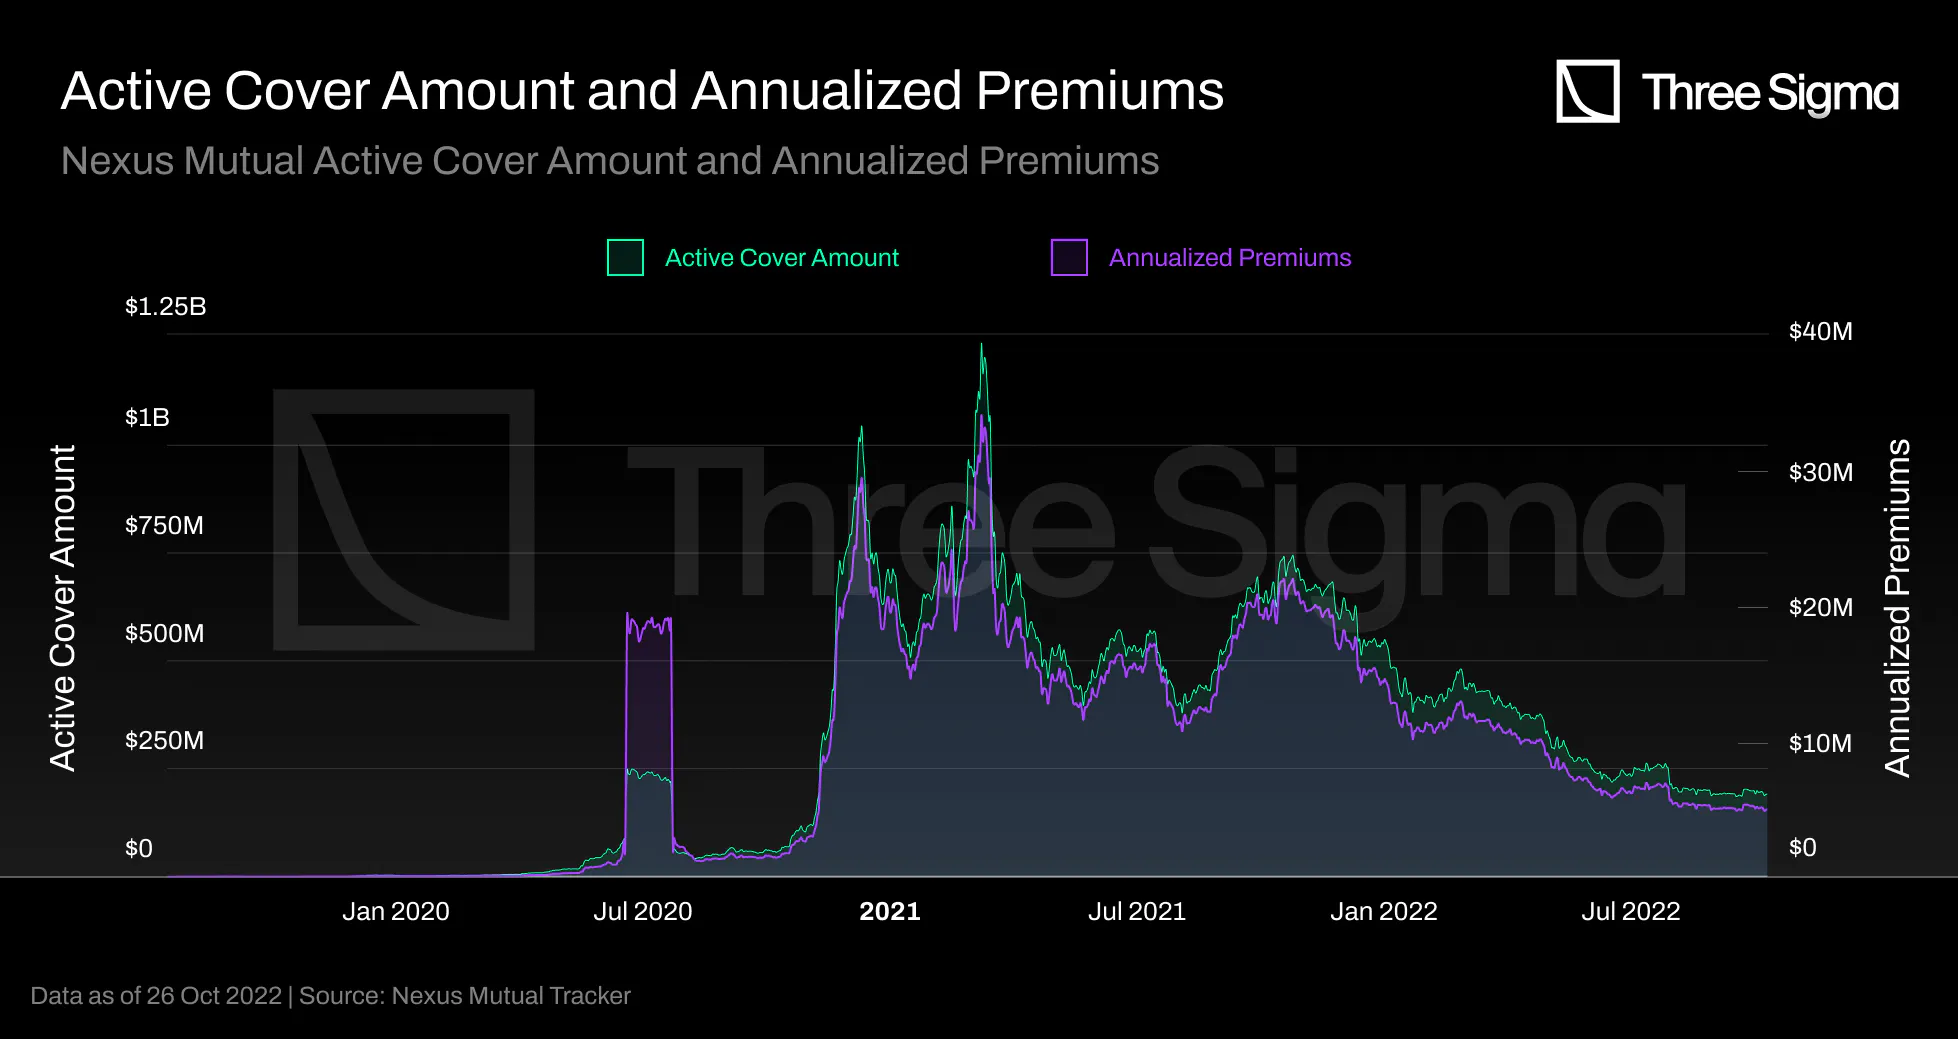
These graphs depict similar behavior but on quite different scales. Nexus' cover price formula is based
on the cover amount, cover duration, and risk amount. This explains this similar behavior, because there
is a direct relationship between the cover amount and cover pricing. As the Total Value Locked in DeFi
Covered rises, so will the Annualized Premiums In-Force.
The Active Cover Amount is always more than an order of magnitude higher than the Annualized Premiums
In-Force scale. This is natural as users only pay a small percentage of the coverage requested.
A larger capital pool (TVL) allow more insurance policies to be sold and increased revenue for stakers
and the Capital Pool. With V2, users can purchase a monthly policy and extend it as long as there is
capacity.
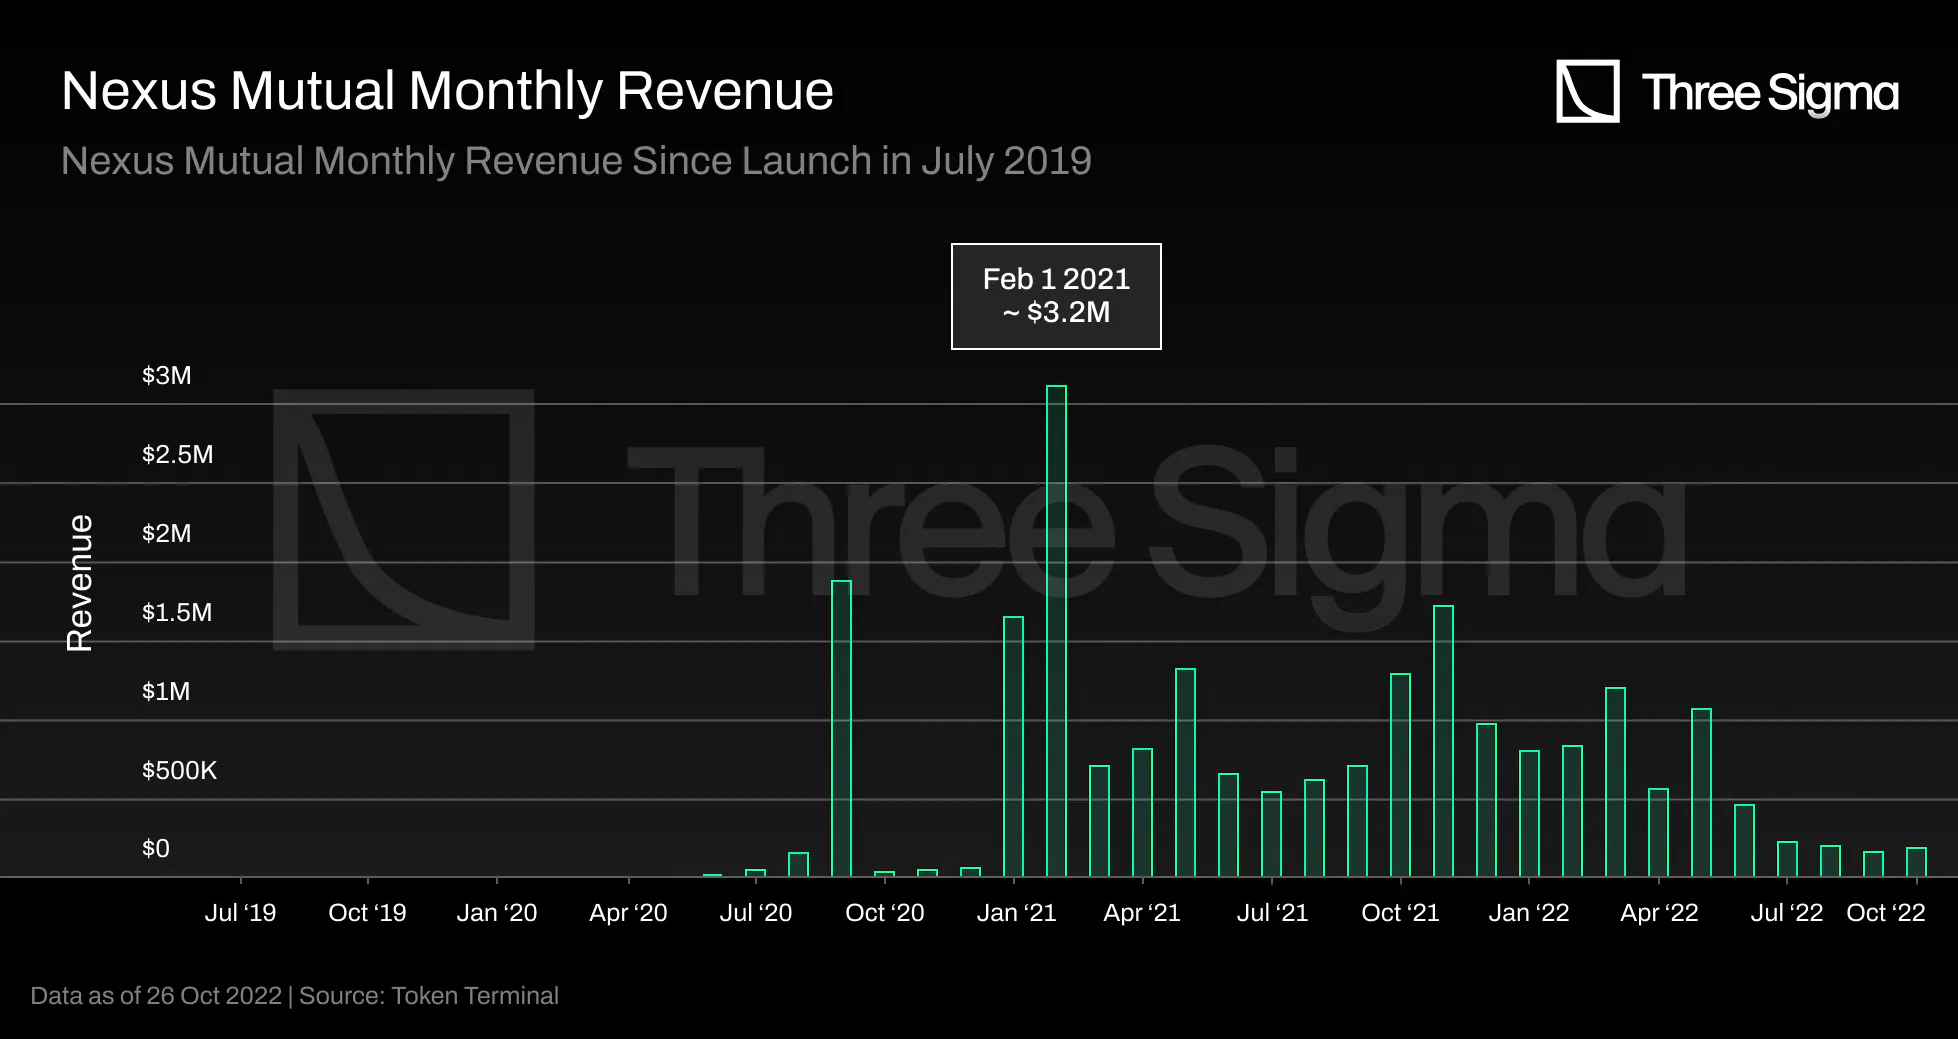
Nexus Mutual started earning revenue one year after its launch, in May 2020, with just over \$2000 in
monthly revenue. The monthly revenue peaked at \$3.16 million in February 2021, during the bull market,
and averaged \$1.2 million per month during 2021. However, the past three months have seen protocol
revenue experience a steep decline, averaging just over $210,000 monthly, due to market conditions.
This chart only considers the fees charged to Mutual members, not the investment earnings. We will
investigate this later. This chart indicates Nexus’ monthly activity, such as the number of new members
paying membership fees or the number of purchase cover policies since the value is paid in advance.
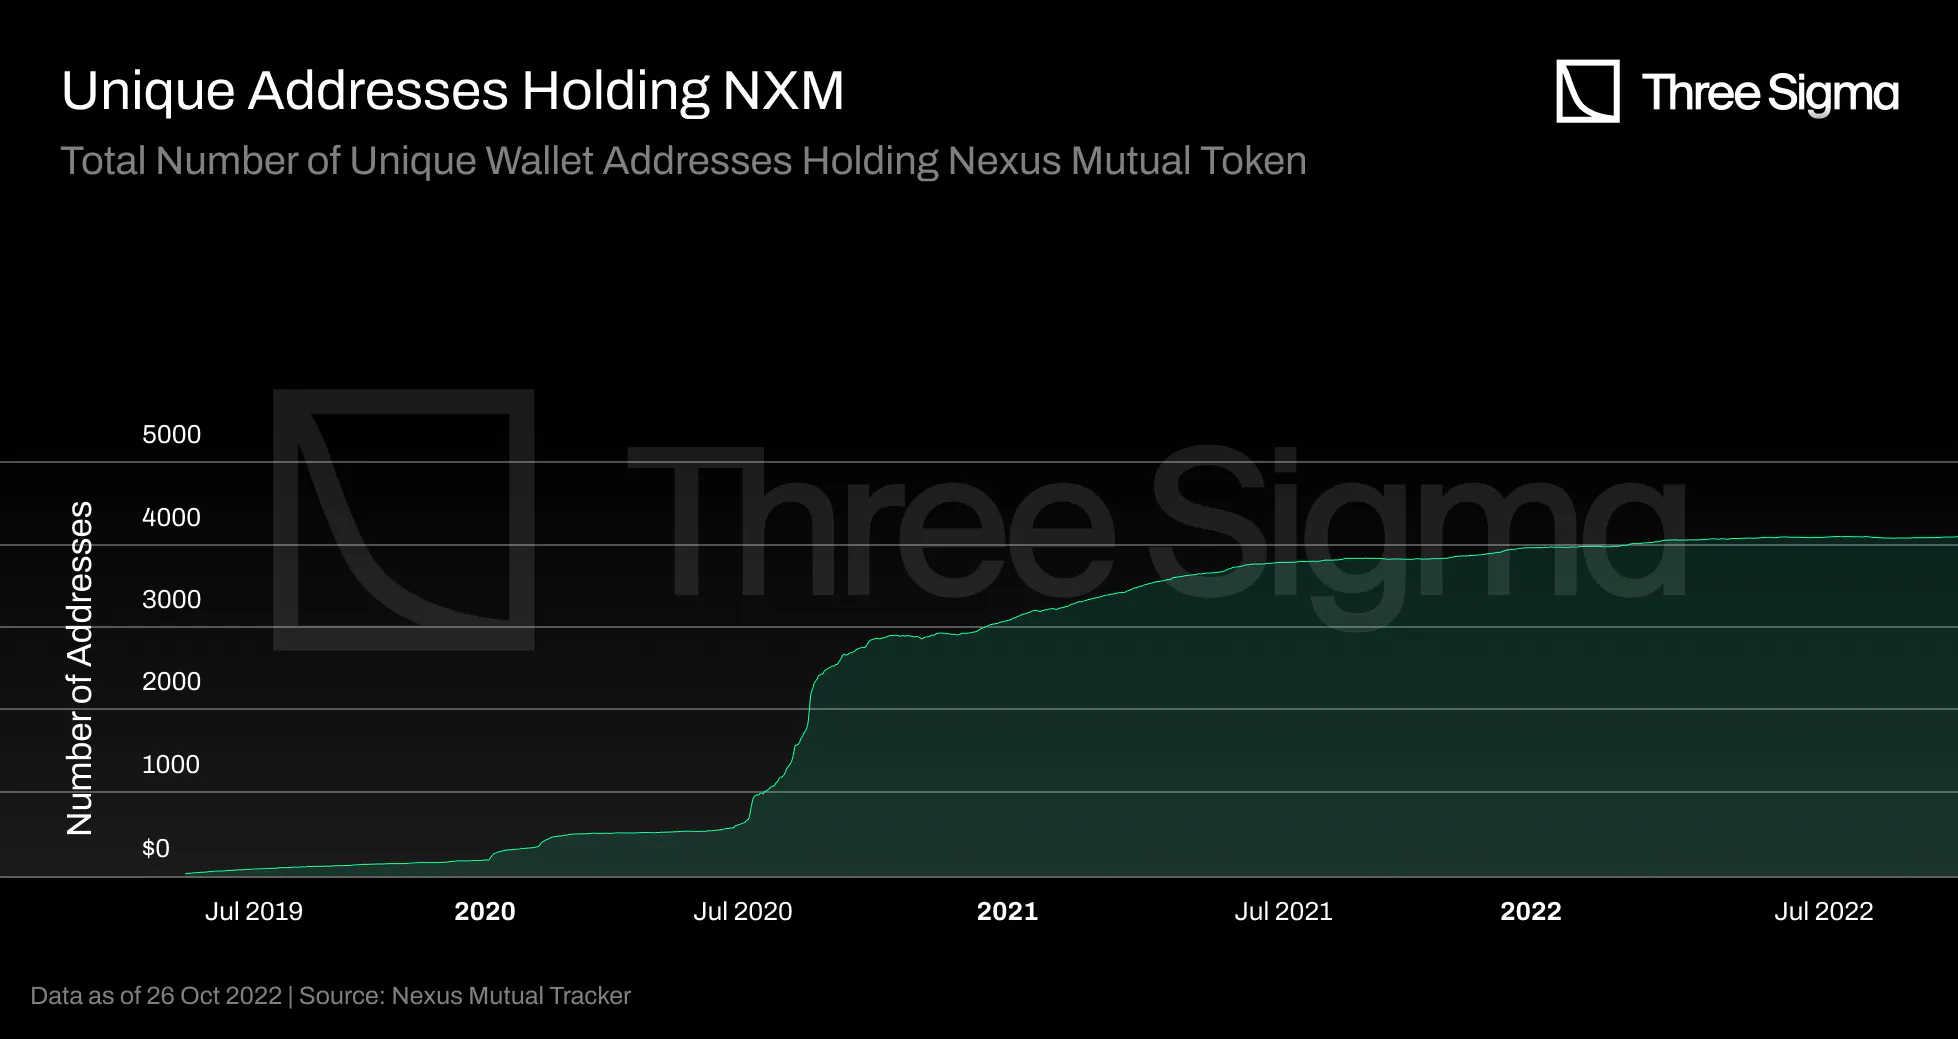
Tracking the growth and daily activity of Mutual members will be a key indicator of future economic
activity on Nexus, as they are the only users who can buy coverage and generate revenue outside of
investment income. In 2022, the number of unique addresses is still increasing, but at a slower rate,
and this could be due to macroeconomic factors.
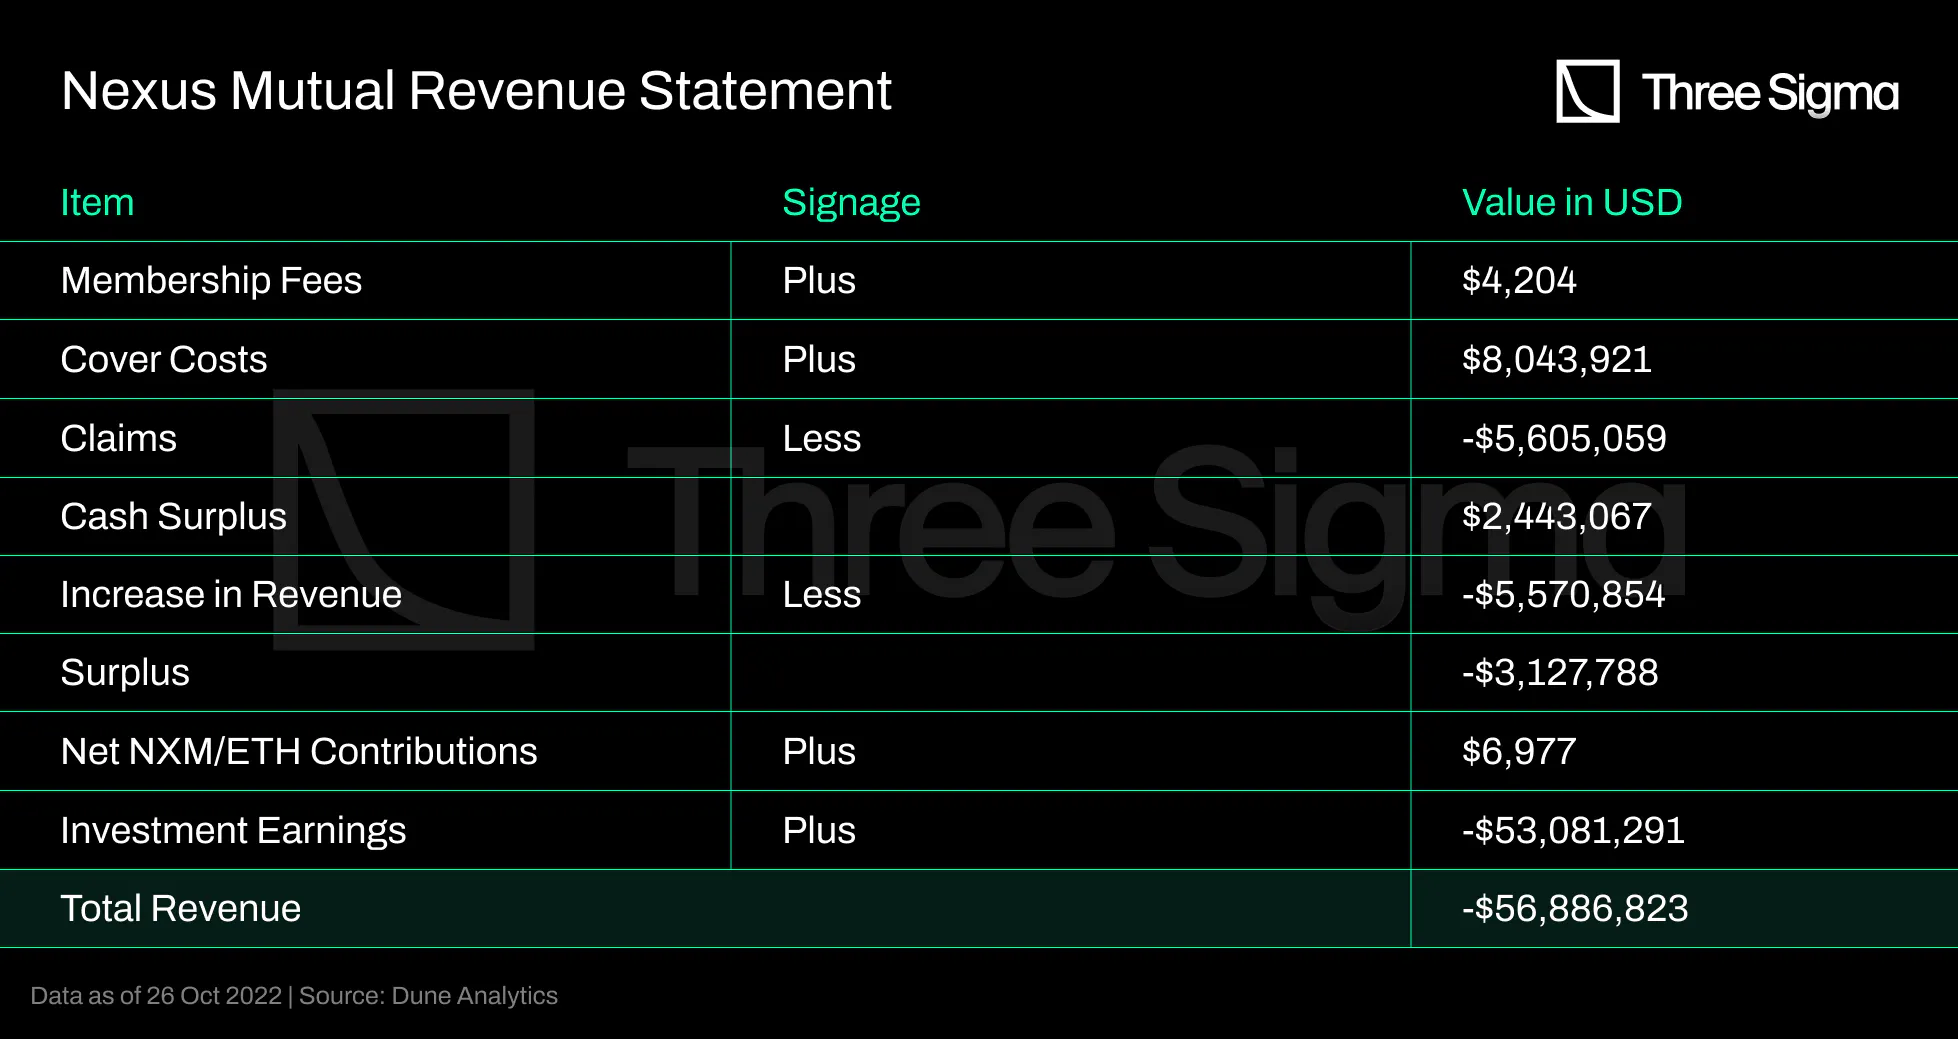
Membership fees and Cover Costs are the primary revenue for the Mutual, offset by claim payments. It is
essential to note that Investment Earning returns can fluctuate based on the time period used and the
market sentiment, with a massive negative amount currently appearing in the financials due to the
current macro effects. Insurers are anticipated to generate greater revenue when more insurance policies
are sold.
Final Thoughts
Nexus Mutual pioneered the Staker-as-Underwriter model, the most common DeFi insurance business model.
With this model, the underwriter (capital provider) controls the claims process, which creates a conflict
of interest that enables legitimate claims to be denied. In addition, Nexus Mutual compels capital
providers to speculate on risk instead of relying on data.
Token holders assume the inherent risk by providing capital in separate underwriting pools for covered
protocols. However, this leads users to perform due dilling in each protocol when most capital providers
seek higher APYs, which can impact the risk cost.
It performs well when no claims are submitted, but when cover providers want to withdraw their funds,
this model begins to fall apart.
InsurAce
InsurAce was launched in November 2020 with a “0” Premium pricing (ultra-low premiums close to 0% powered
by its dynamic pricing model), no-KYC wallet-based accessibility, cross-chain coverage and a
first-of-its-kind portfolio-based design, which allowed users to cover a basket of protocols. It
launched on Ethereum's mainnet in April 2021 and subsequently expanded to chains like BNB Chain,
Polygon, and Avalanche, among others, granting users access to a multi-chain world.
InsurAce provides insurance cover, including smart contract vulnerability, stablecoin de-peg, IDO risk,
and custodian risk with its unique portfolio-based coverage and customized bundled covers.
At launch, InsurAce provided two services, an insurance module and an investment module. To achieve its
“ultra-low premiums”, the insurance allows users to place funds from the capital pool in the investment
pool to gain a higher yield. Meanwhile, the investment module’s yield helps lower insurance premiums and
reduce coverage costs for users.
InsurAce Participants
There are three types of roles in InsurAce: the Investor, the Insurer and the Insured.
The investment arm is still under development. The Insurer stakes ETH, DAI and other assets to an
aggregated pool and earns an investment income, premium covers as well as INSUR rewards. In V1, insurers
are exclusively rewarded with INSUR tokens; the plan is to share premium covers in V2.
The Insured purchases insurance products and earns INSUR rewards and claim rights.
Cover Pricing
The InsurAce Protocol team argues that a staking-driven price structure, like the one Nexus Mutual uses,
fails to properly assess a protocol’s real risks, causing cover providers to charge too much for covers
when fewer funds are staked. This led them to use a Dynamic Price model to determine premiums,
introducing a minimum and maximum price. The premium is varied between these values, where the minimum
price is a base premium, and the maximum is three times this base premium. The more cover sold, the
higher the premium and vice-versa.
For each product, the premium for the first 65% of the total capacity will remain unchanged, equal to the
base premium. The premium for the remaining will increase following the dynamic pricing model. The base
premium is calculated by taking into account the aggregate loss distribution model and risk factors of
the protocol. The aggregate loss distribution model is an actuarial model that combines frequency and
severity (based on a number of claims and exposures in a given time period for a protocol), and it is
used to calculate the expected loss at the portfolio level.
The main inputs are the number of claims and exposures in a given time period. These are used for
selecting and training two separate models: the frequency model and the severity model. Frequency
modeling produces a model that calibrates the probability of a given number of losses occurring during a
specific period. Severity modeling produces the distribution of loss amounts and sets the level of
deductible and limit of the coverage amount. Both models are combined to determine aggregate loss, which
is incorporated into protocol risk factors, and so are calculations for the base price of each protocol
formulated.
The models’ parameters are based on historical data, which can be difficult to find in the DeFi
landscape. More often than not, when an exploit or hack happens that results in the need for insurance,
it is the end of that particular protocol, so retrieved data would not be directly useful in the future.
The collection of such data by machine learning algorithms seems like it could be used in an aggregate
way if there are many data points available in the future, but it’s possibly dangerous to use when there
is a small sample.
Pricing structure is not on-chain, which is common in DeFi insurance protocols, but clearly an important
improvement point for the sector. While pricing is off-chain, users can’t understand why and when
pricing changes, and it requires trusting the team, as there is the possibility of price manipulation.
Capital Model
InsurAce's capital model refers to EIOPA's Solvency II, the prudential regime for undertakings in the EU,
in line with Nexus Mutual. There are different tiers of capital requirements under this regime, namely
the Solvency Capital Requirement (SCR) and the Minimum Capital Requirement (MCR). While the first refers
to the capital required to ensure the fund will be able to meet its obligations over the next 12 months
with a probability of at least 99.5%, the MCR takes lighter restrictions and refers to the capital
required to meet the obligations over the same period with a probability of at least 85%.
InsurAce uses SCR, as opposed to the MCR used by Nexus Mutual, as the capital standard to calculate the
minimum amount of funds to reserve to potentially pay claims. It is calculated by taking into account
all active covers, all the outstanding claims, the potential incurred but not reported claims, the
market currency shock risk, the non-life premium and reserve, lapse and catastrophe risks, and the
potential operational risk. The calculation of the SCR is performed daily off-chain. The team reviews
and updates this information on-chain in the case that there is a noticeable difference.
The capital pool is built by funds pooled together by the mining pools, cover payments, and investment
pool (all governed by INSUR token holders). In line with the MCR% used in Nexus Mutual, InsurAce uses
the SCR%, which is the ratio of capital that it has available to support is SCR. It is also known as
Capital to Risk Assets Ratio and it is calculated as the capital pool size divided by the SCR. The
lowest acceptable ratio is 100%, which occurs when there are exactly enough funds to cover the SCR.
The Capital Efficiency Ratio (CER%) is used to measure the short-term success in deploying capital and
corresponds to the ratio of output per amount of capital deployed. InsurAce calculates it as the active
cover amount divided by the capital pool size. The desired ratio for InsurAce is between 100% and 300%,
which is considered to signal high productivity and moderate risk exposure.
At time of writing, Nexus Mutual has an MCR% of 94%, while InsurAce presents an SCR% of 238%. Although
the SCR and MCR are very similar metrics, where SCR seems to represent the strictest, i.e., safest, of
both, it is worth noting that the way in which they are calculated can be different. Both InsurAce and
Nexus Mutual run these calculations off-chain, so it is difficult to check whether the same standards
are upheld.
Tokenomics
INSUR tokens are used as a representation of voting rights in governance votes such as claim assessment,
as mining incentives for capital providers in both the mining pool and investment products, to earn fees
generated by the protocol by InsurAce.io through governance participation, and for other ecosystem
incentives. More use cases are expected to be introduced as the protocol develops.
Users who stake tokens in the platform earn INSUR token rewards. The InsurAce Protocol refers to this
process as mining. Mining by staking in either InsurAce’s Cover or Investment arms is governed by the
following equation:
$$Speed(Investment) + Speed(Cover) = C$$
where $C$ is determined by the token economy over time, ensuring a balance between the $Cover$ and
$Investment$ arms.
For the capital pools in the Cover Arm, mining speed is determined by the InsurAce protocol's SCR ratio.
When they are insufficient to meet the SCR, the mining speed for the Cover Arm increases to attract more
capital, helping InsurAce lower its prices and reduce insolvency risks. The pool with less capital
staked will have its SCR mining speed adjusted to attract more capital. This reverts back to normal once
the SCR is met and the Investment Arm’s mining speed increases to attract more funds.
More formally, the Speed for pool i is determined as follows:
where $S_i$ is the number of tokens staked in a cover capital pool at time t, $S_{max}$ is the number of
tokens staked in the largest pool at t − 1 whose mining speed is $S_{min}$ , and λ is the speed scale.
INSUR tokens can be bought on centralized and decentralized exchanges and bridged to and from any of the
networks the protocol operates in.
While INSUR is a governance token and doesn’t have a direct utility, sell pressure is created which can
lead to the decrease of token value. This can change if more uses cases are introduced.
Claim Assessment
The InsurAce Claims Process is similar to Nexus. A user may submit a claim within 30 days, and no later
than 15 days after the coverage has expired. As soon as the claim is submitted, the Advisory Board
initiates an investigation based on the proof of loss and other publicly available information, and
shares a Claim Report with their findings and conclusion with the community. Once this is accomplished,
there is a voting process that requires more than 75% of claim assessors (INSUR stakeholders) to be
valid. In invalid voting processes, the advisory board evaluates the situation and makes its own
decision. The user may contest rejected claims for 1% of the rejected claim amount but the Appeal is
handled by the Advisory Board, which has sole authority to make a final determination.
This brings up the same issues mentioned previously when analyzing Nexus: the Advisory Board has too much
power, is centralized in a small number of individuals, can influence claim assessors with their report,
and there is a clear conflict of interest because stakers are the ones deciding whether or not to pay
out a claim, despite the fact that they are the ones who will be penalized for the payment.
Adoption and TVL
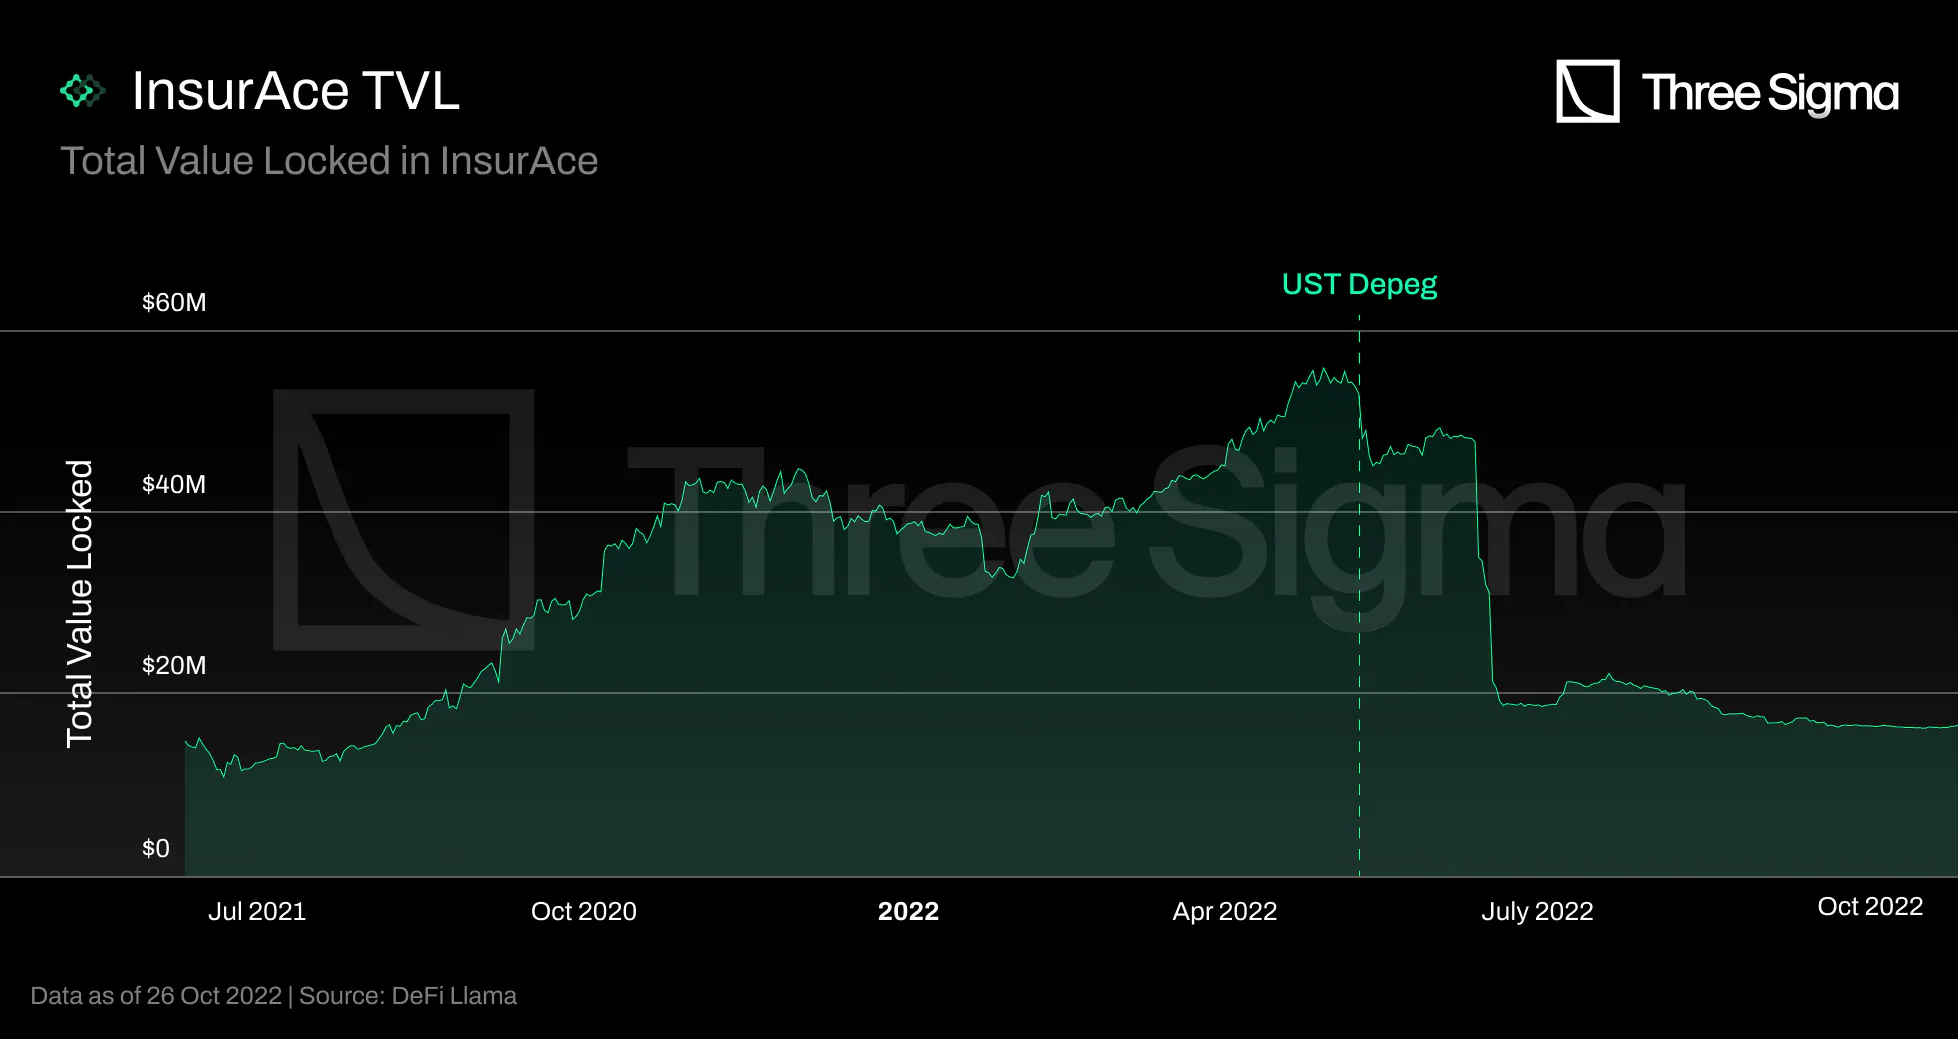
The Total Value Locked of InsurAce has grown from \$14 million in June 2021 to a peak of \$55.8 million
on April 29 2022, an increase of almost 4x. The TVL could have decreased between 7-13 May due to losses
in UST or Anchor, but the InsurAce investment arm is still in development, and the team did not make any
investments. Since the Terra collapse occurred in early May, this likely occurred due to the capital
providers' fear of the impact on claim payouts. In May, the claims were submitted and approved, but the
payments were only processed on June 11. Hence, LPs withdrew their funds to avoid being slashed by these
payouts. However, they were then subject to a 15-day unlocking period, which exacerbated the negative
impact on the TVL after June 11. The InsurAce TVL began a steep decline after that, falling from \$48
million to \$20 million within a week, and has been on a slow decline ever since.
Stakers were unable to withdraw funds from the pools while the InsurAce team assessed the value of
accepted claims to determine whether there was sufficient capital in the pools. InsurAce attempted to
persuade LPs to keep their funds in the pools by announcing a compensation plan for stakers who remained
in the pools after all claim payouts were settled, but after locking the funds for an undisclosed period
of time, that incentive was insufficient to keep capital in the pool.
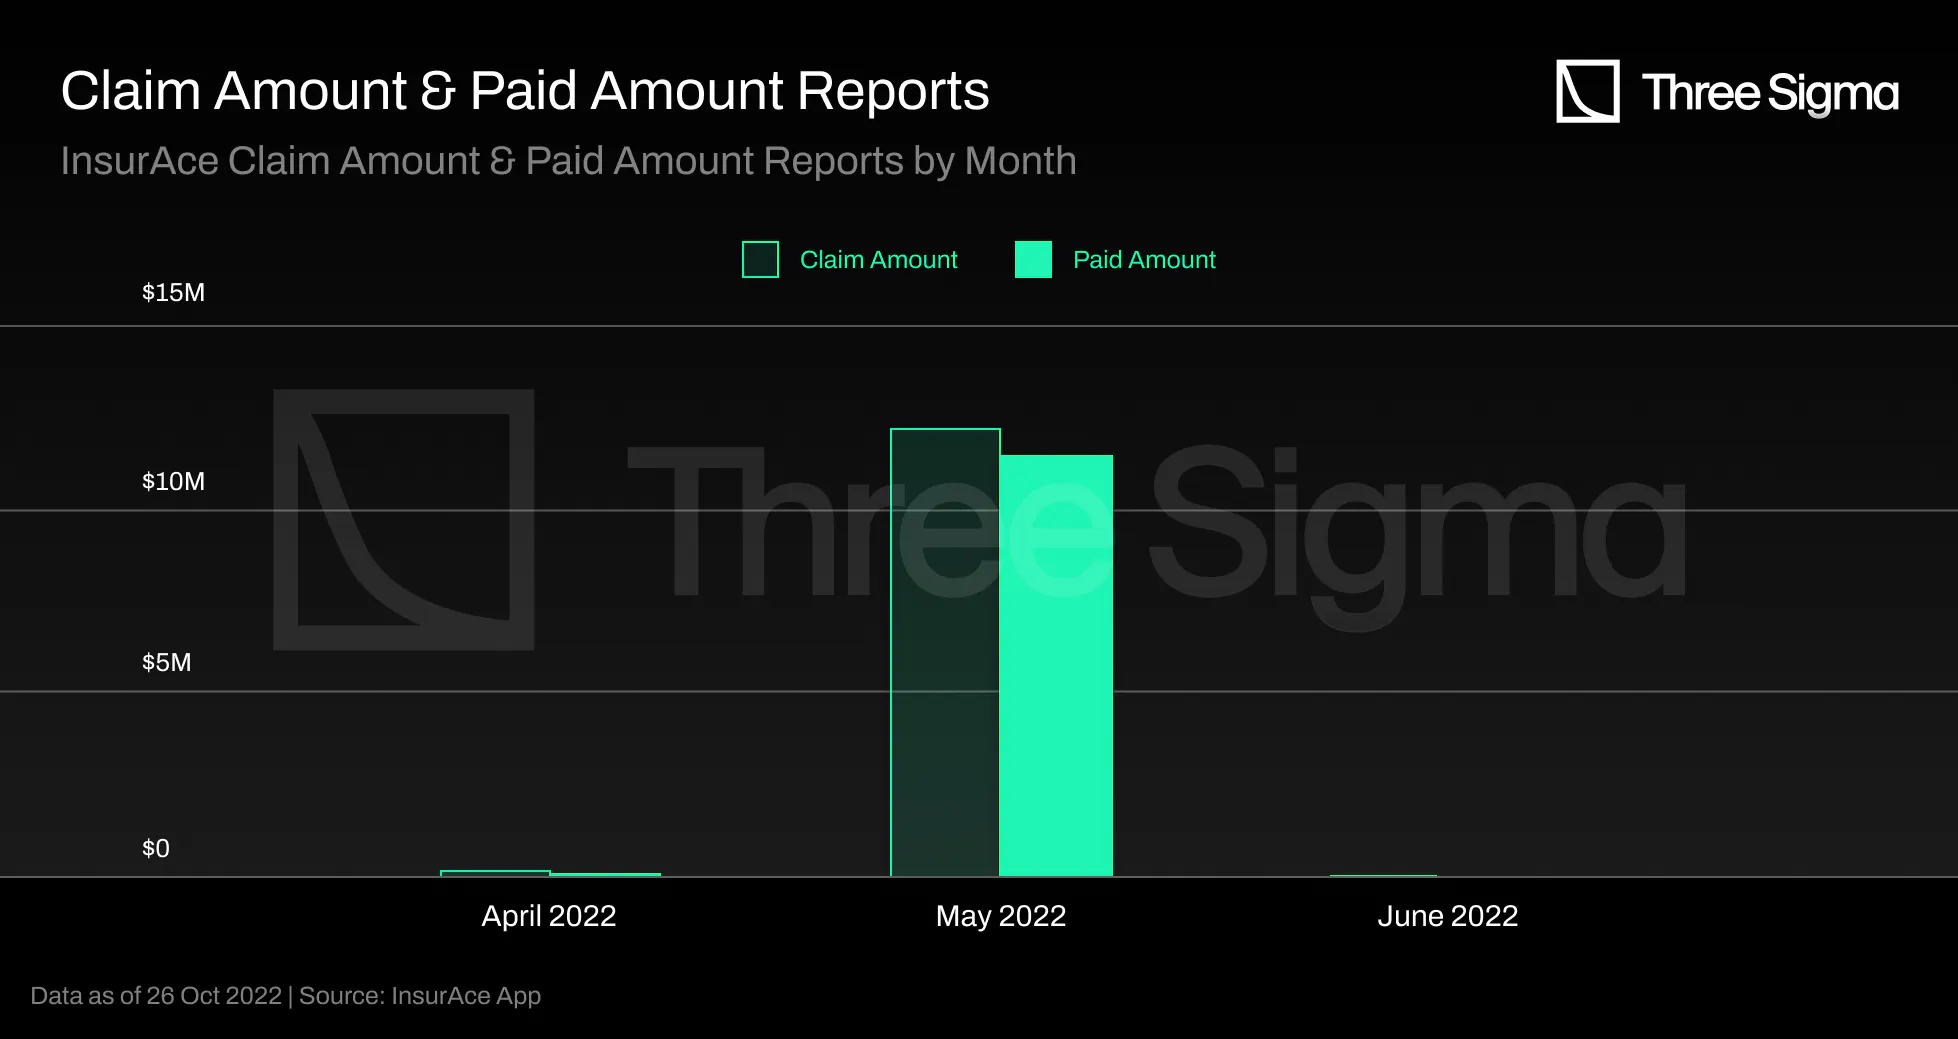
InsurAce covers 140 protocols and has already paid out \$11.6 million in claims. From a total of 215
claim requests and 161 claim requests that were approved, 177 claim requests were submitted and 154 were
approved in May. In June, the UST Depeg event caused a significant decline in InsurAce's TVL. The most
amount of claims were paid out in June, totaling \$11.5M out of a total of \$11.6M. The chart indicates
that payments were made in May, but the team is already working on a fix for this input error, as the
payout date is currently the same as the claim data, despite the fact that the actual payment date was
June 11.
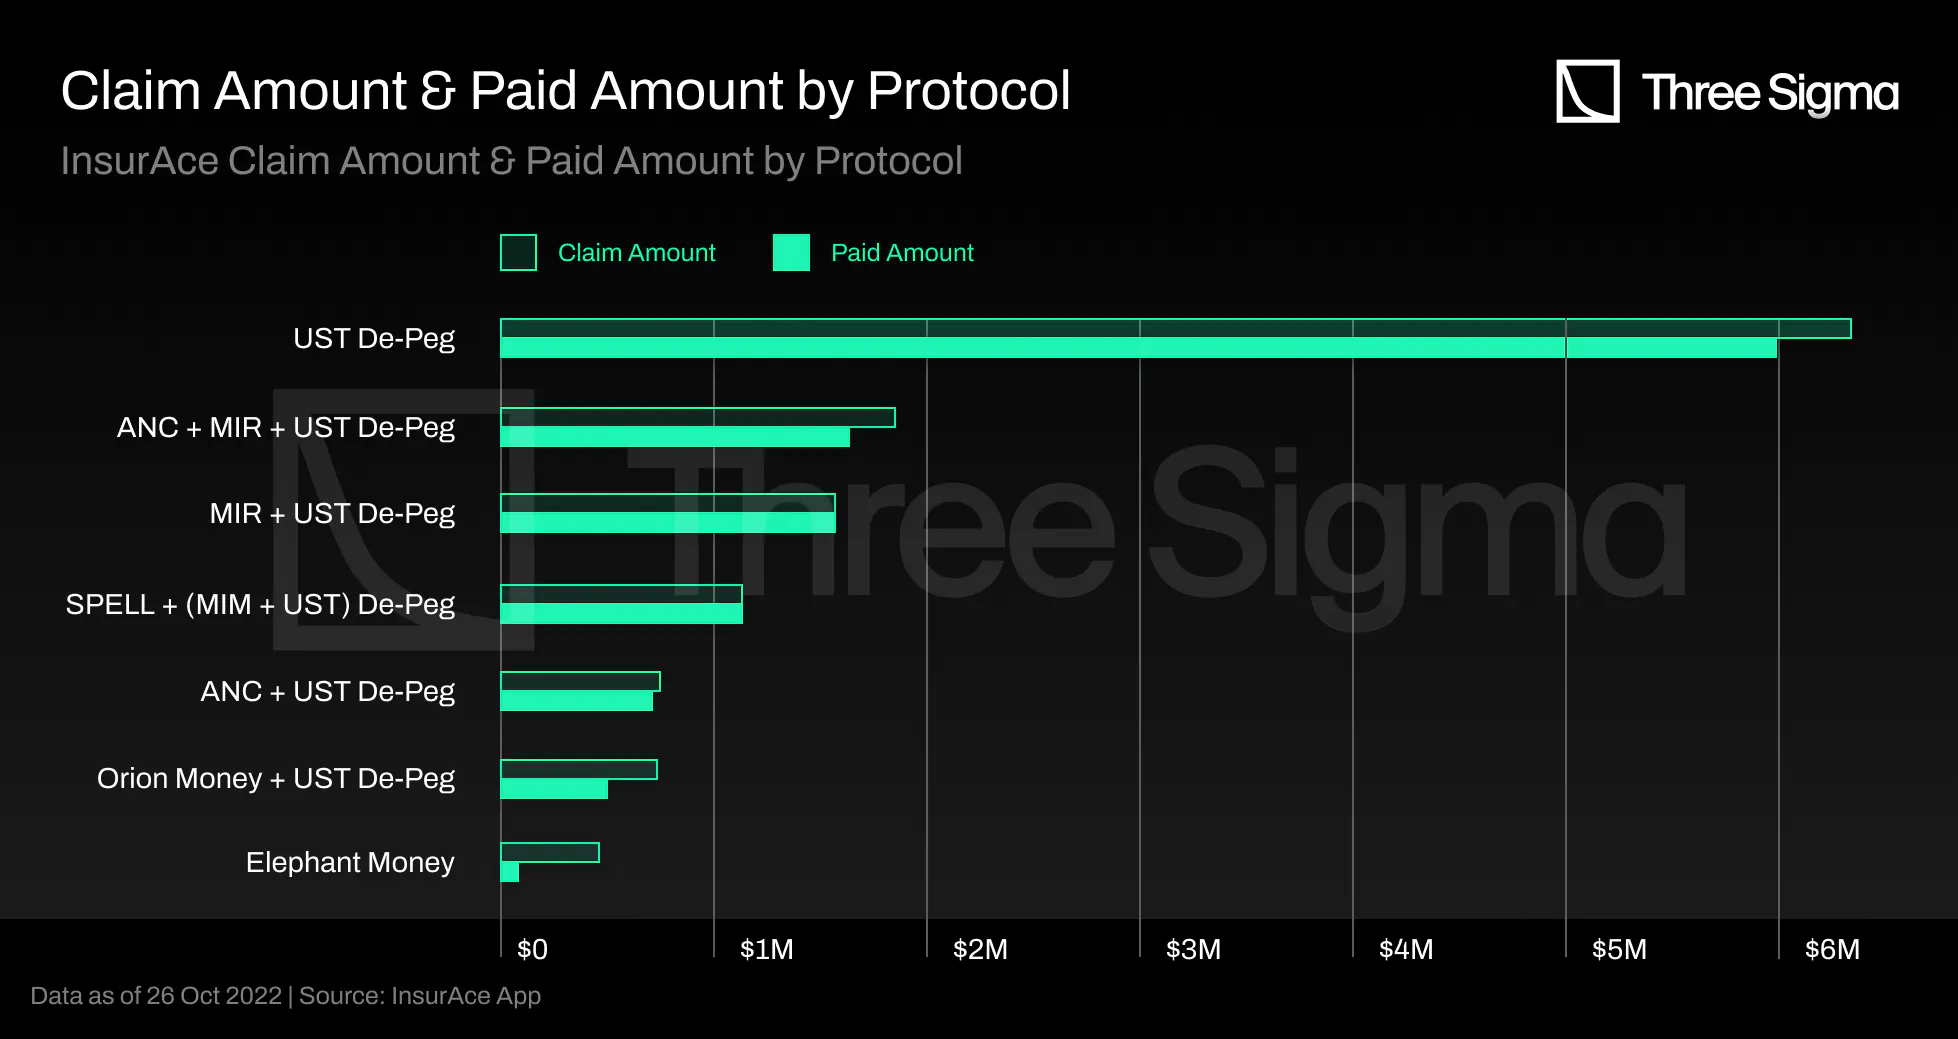
Furthermore, the vast majority of these claim payouts were due to UST Depeg or UST Depeg-related bundle
coverages, as shown in the chart presented above.
TVC
InsurAce is currently covering \$15.6M in assets, totalizing \$348M in total value covered since its
launch.
The largest amount is currently covered on Binance Chain, while Ethereum is surprisingly in last place,
with Polygon demonstrating the demand for L2 solutions. The protocol with the highest cover amount,
totaling \$1.8M, is GMX, followed by Benqui with \$1M, and the majority have less than \$0.2M each.
Ethereum being the chain with less covered amount may indicate that InsurAce is not as attractive when
there are more insurance alternatives, as most other insurance protocols operate only on Ethereum.
InsurAce and UST Depeg
The InsurAce.io UST De-Peg cover was officially triggered on May 13, 2022, after a 10-day Time Weighted
Average Price (TWAP) of UST below $0.88, as specified in their UST De-Peg Cover Wording. The cover
amount was paid to those who held UST or any representation of UST supplied directly as liquidity in
their wallets or accounts with any custodians at the time of the Cover's purchase and on May 13, 2022,
and who held active UST De-peg Cover on May 13, 2022. InsurAce was overexposed to UST with roughly 21m
of exposure. This event had a huge impact on the capital pool which lead to InsurAce protecting over 155
UST-related investors.
On 11 June, out of a total of \$12.2M in claim requests, \$11.5M were paid. The Terra collapse had a
significant impact on InsurAce TVL and, consequently, SCR, but the team has been working on their risk
modeling and capital efficiency models to recover from this occurrence. Reduced SCR entails reduced
capacity for cover amounts, but the team has also severely constrained capacity compared to before the
UST payouts.
Revenue
InsurAce’s goal is to generate revenue from the insurance premium and carries from the investment
returns. Currently, since the investment arm is still in development, insurance premiums are the primary
source of revenue.
The revenues are intended to be used in operation and development costs, token buybacks, community
incentives, ecosystem collaborations, and more.
Unlike the case in some protocols that are analyzed below, once purchased, InsurAce coverage cannot be
sold or modified.
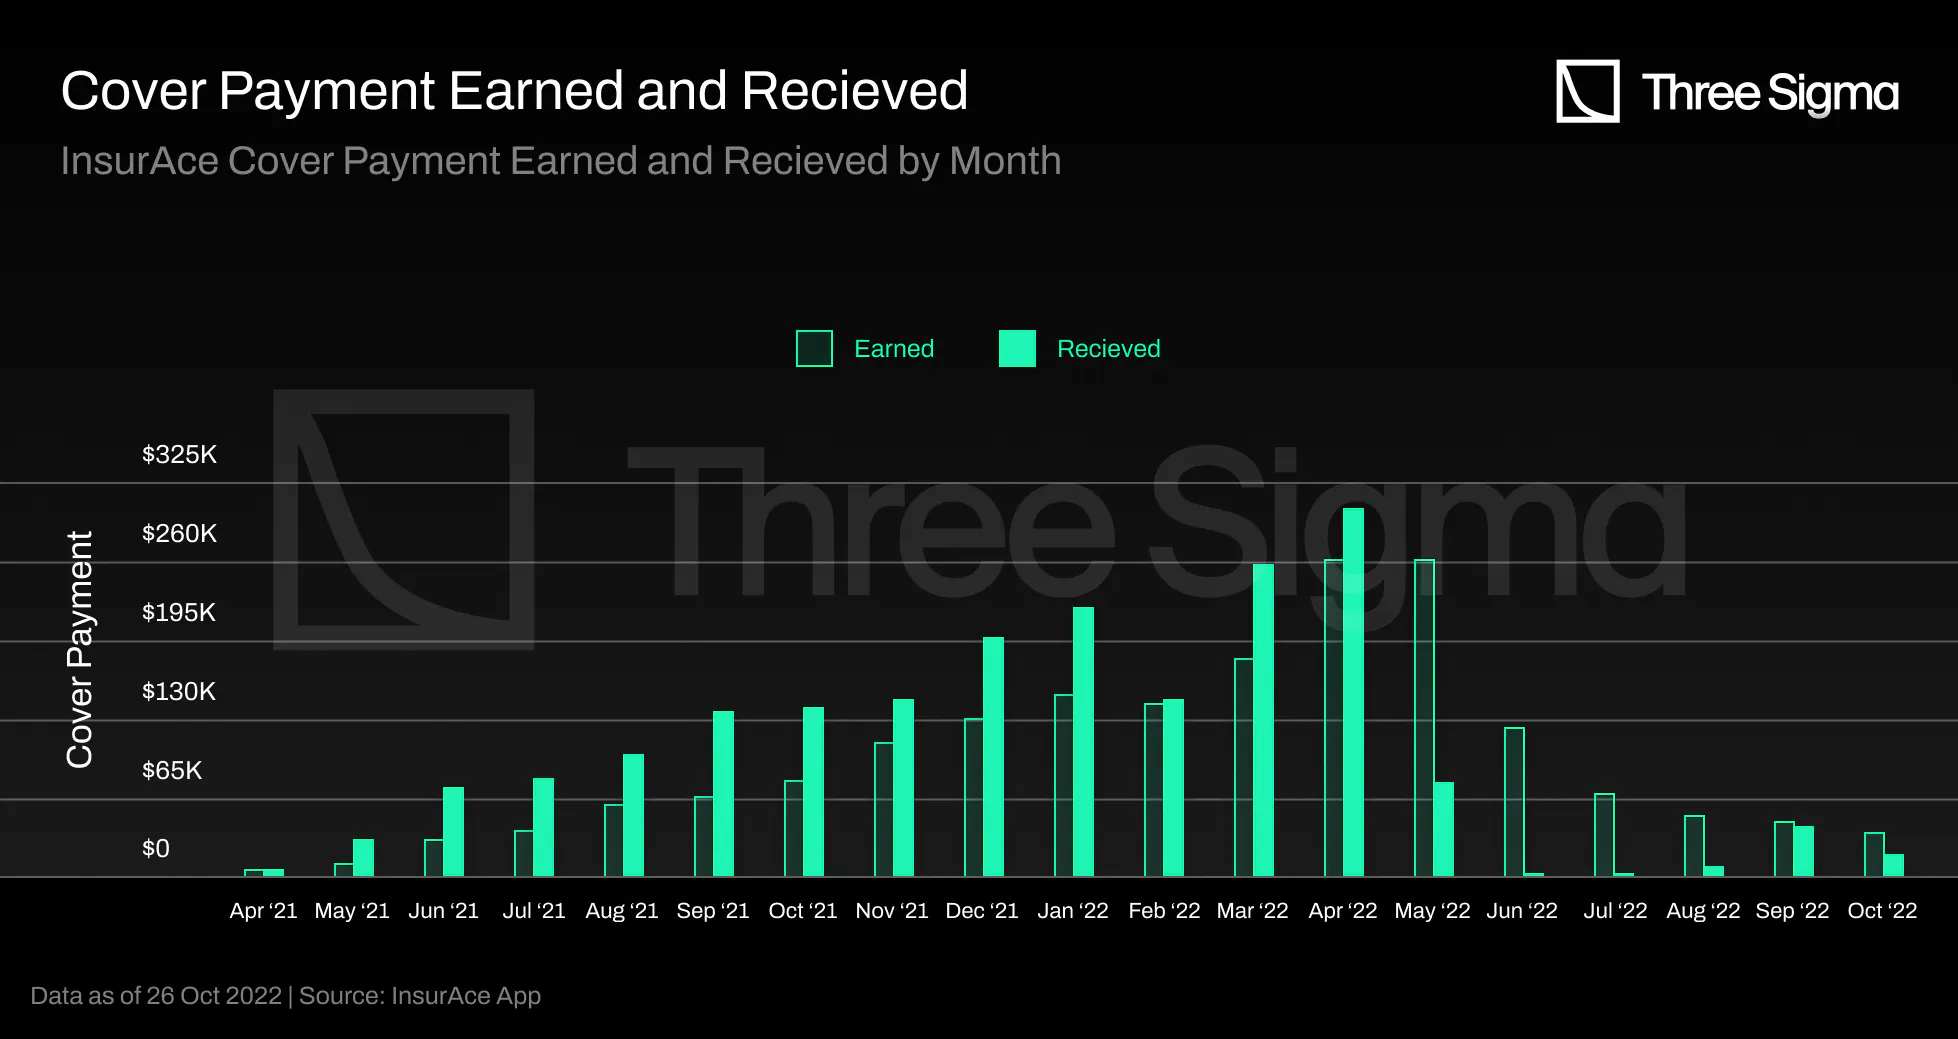
The premium is paid in advance, but is only counted as "Earned" on a monthly basis, as some policies may
be canceled prior to the expiration date, in which case the protocol will refund the remaining value to
the user. The values referred to as "Earned" represent premiums, and the values referred to as
"Received" represent revenues distributed over the duration of the policy, not taking into account
cancellations of policies but counting the additional revenues from other sources, such as grants from
chains. The revenue value was steadily increasing until the collapse of Terra forced InsurAce to pay
nearly $12 million in claims.
Prior to the UST Depeg event, the "Received" amount was increasing as a result of new policy sales, and
the "Earned" amount was also increasing as a result of new monthly payments.
After the event, the “Earned” amount was impacted because monthly claims payments to protect UST holders
ceased; nevertheless, the protocol continues to earn premiums from long-term coverages. The “Received”
amount was also impacted because, in general, people stopped purchasing coverage in InsurAce after the
incident and were unable to do so due to the low SCR%.
Notably, the chart does not include operational costs, which include the amount spent on INSUR rewards
for capital providers. The team reserved 45% of the total supply for mining rewards from the beginning,
and the remaining time on that supply is likely two years. The team intends to divide revenue and profit
sharing from the investment arm with capital providers in the future, but the percentage has not yet
been made public.
Final Thoughts
InsurAce's underwriting model is based on a business model inspired by the DeFi summer liquidity
incentives concept. In order to accelerate underwriting, InsurAce issued Mining incentives, which offer
insurance providers APY paid in INSUR tokens. InsurAce APYs are based on supply and demand to
incentivize capital providers to assist with token rebalancing in order to maintain an even distribution
of underwriting tokens with sufficient capital for modeled payouts. This model provides a simple way to
bootstrap liquidity quickly, but LPs who seek higher APYs will leave the pool as soon as they find a
protocol with a higher APY.
Regarding cover pricing, it is interesting that InsurAce uses machine learning models to estimate
parameters typically used in traditional insurance. However, the data that is available for the DeFi
space seems to still be far from the necessary amount to employ these models.
The UST depeg event proved that insurance in DeFi serves its purpose and in the case of InsurAce,
claimants were indeed reimbursed. This is a great step towards adoption, although it took a great toll
on the SCR and the protocol seems to be having difficulty recovering from it. Having mechanisms in place
to quickly recover from these situations or be protected from them is concluded to be very important.
Armor.Fi/Ease.org
Armor was introduced in January 2021 with the intention of solving fragmented liquidity and limited
coverage capacity in the majority of protocols by extending the Nexus Mutual insurance model but
removing the Know Your Customer (KYC) requirements using the arNXM vault. Despite successfully making
Nexus' coverage products DeFi-compatible in 2022, the core Team felt that the premiums model was not
optimal for DeFi. Armor introduced the Uninsurance (Reciprocally-Covered Assets - RCA Coverage) model
and changed its name to Ease.org in May 2022.
The arNXM vault allows users to provide collateral to Nexus Mutual without a KYC check by acting as a
custodian on their behalf. In addition, the Armor team actively monitors yield and risk factors and
designs staking strategies accordingly. The yield-bearing nature of arNXM allows all rewards generated
by underwriting Nexus protocols to be distributed directly to arNXM holders. This vault currently
provides over 30% of all underwriting funds to Nexus Mutual but has provided 45% in the past.
Armor also introduced a new product in the DeFi space, arCore, based on a pay-as-you-go (PAYG) model,
with duration and coverage limits that can be customized. This product offered a PAYG model by charging
the insurance policy by block and offered customized duration by allowing users to purchase coverage
from a pool of staked arNFTs that did not lock the funds into a fixed contract. Despite being an
innovative insurance product, issues with gas costs on the Ethereum mainnet directly inhibited the
flexibility that this solution sought to provide, as insurers with smaller wallets were charged
block-level fees that were unaffordable. The protocol was discontinued at midnight on May 31, 2022 (UTC)
along with the new rebranding strategy, which will be explained in greater detail later.
The arNFTs are yet another product created by the Armor team, and offer users a new way to interact with
Nexus Mutual and their coverage policies. Users can mint arNFTs for any protocols for which Nexus Mutual
coverage is available, and they will receive an ERC-721 token that they can hold, sell, transfer, or
stake to receive fees in ETH and rewards in $ARMOR. The arNFTs will continue to be developed by the Ease
team, with new features on the horizon, but they will no longer be able to be staked in the discontinued
arCore product.
To meet the increased demand for coverage, Armor developed a second product called arShield, which
streamlined and aggregated coverage via Shield Vaults, where users could deposit assets and receive
passive coverage for as long as they remained in the vault. The premium cost was deducted from the asset
yield, eliminating the need for upfront payments and lowering the premium cost. This concept gave rise
to the shared risk ecosystem for which Ease protocol is known today. Since Ease is now live, the
arShield vaults have been discontinued.
Reciprocally-Covered Assets (RCAs) were first introduced by the Ease team and are a DeFi-native coverage
method in which covered assets simultaneously underwrite the other assets in the ecosystem. This new
model enables users to store tokens in Uninsurance vaults with a one-time, vault-wide fee in the event
of a hack. These premium-free Uninsurance vaults are possible due to the fact that RCAs are a method for
collecting underwriting capital directly from deployed capital within DeFi yield strategies and
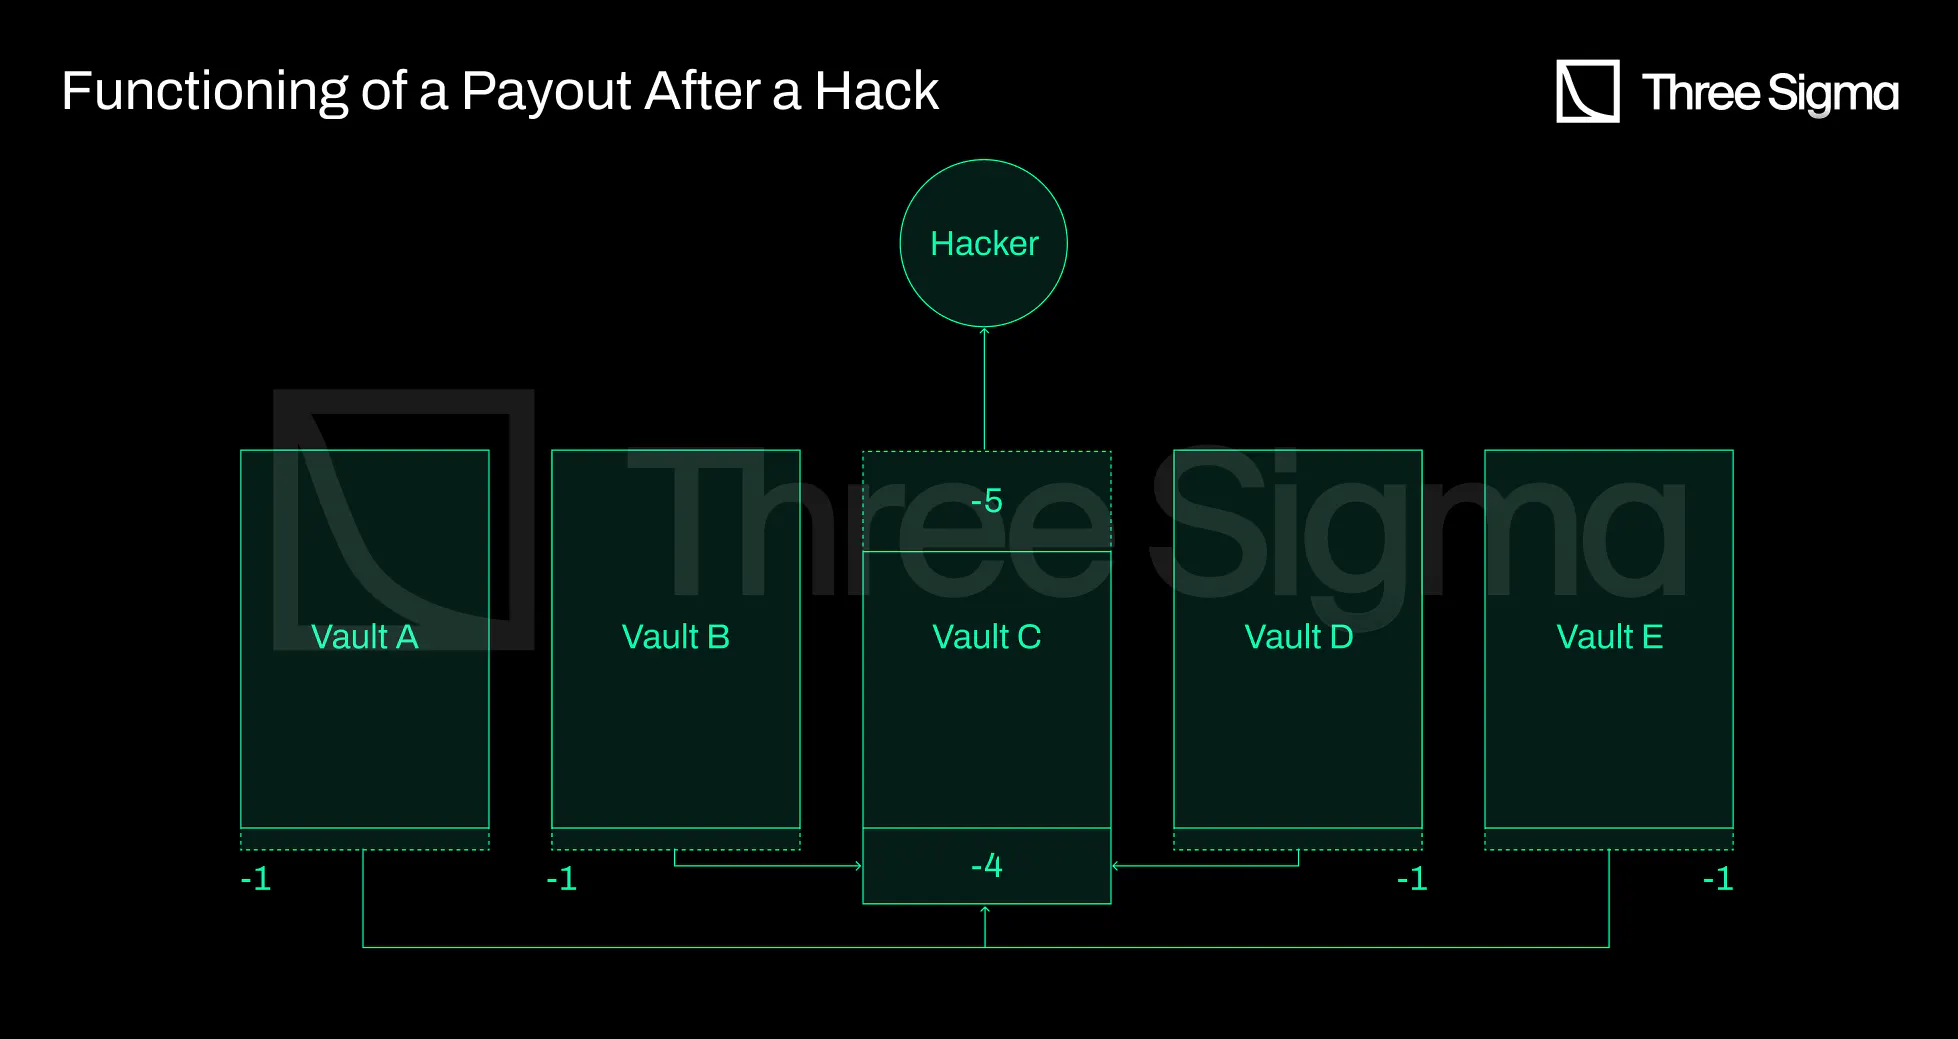
deducting the premiums directly from the generated yield. In the event that one of the strategies is
exploited, Ease liquidates a proportional amount of funds from all vaults to compensate investors. From
there, future premium payments replenish the payout liquidation's capital. Since the cost is only
incurred in the event of a hack and is spread across all participants, a larger number of participants
results in a lower individual fee.
The benefit of this system is that the risk is distributed across the entire ecosystem, as opposed to
being carried by a single vault or protocol, and that users are not required to pay premiums unless
there is an exploit. Since risk is proportionally distributed among users, a larger hack will result in
larger payouts to users, but will never lead to complete insolvency, resulting in a much more resilient
coverage model. Additionally, the user's funds are never fully covered, as there is a capacity
restriction on the vaults in order to maintain solvency. If 25% of the RCA ecosystem is hacked
simultaneously, only 75% of the stolen vaults will be reimbursed, as impacted vaults will only be
compensated an amount equal to the losses of other vaults. If the hacked value is greater than the total
RCA value, the system fails (imagine that there is a hack on DeFi that affects a lot of protocols at the
same time). The Ease team attempts to prevent this by not adding any protocols to the ecosystem,
auditing protocols, and performing due diligence on protocols the team intends to add. With increasing
protocol diversity, this type of system becomes more secure.
Claim Assessment
Armor’s claim assessment is identical to Nexus, but with Armor governance replacing the Nexus Claim
Assessors in the first instance of a claim. In Ease, the DAO will have final say over the contents of
each vault's coverage. In RCA's system, all losses are incurred directly from the vault of assets rather
than from individuals, thus eliminating the need for proof-of-loss and claim procedures. The DAO votes
on the amounts that must be returned to each affected vault and allows the liquidation of tokens from
other vaults to complete the payout. Claims payouts will be made by sending affected vaults ETH or a
stablecoin, after which users may withdraw payouts proportional to their vault holdings.
When an exploit event occurs, the protocols that are deemed safer will get slashed less, whereas the
least secure protocols will be slashed the most. The safeness of each protocol is determined by the
broad community itself through Ease token delegation.
The conflict of interests is the primary issue with this approach to stakeholders as insurers. Because
the DAO votes on the amounts that must be returned to each affected vault and allows liquidation of
tokens from other vaults to complete the payout, there is an incentive to accumulate votes to avoid
getting slashed. Protocols with higher TVL in the vaults will contain more EASE and so the DAO will vote
to return more funds to larger protocols. It is a smaller-to-larger protocols insurance, not an
all-to-all insurance.
Risk Assessment
Technically, reciprocally-covered assets do not require a detailed risk assessment to function. Since no
premiums are charged for coverage, Ease is able to cover protocols without a specific risk assessment,
with the Armor DAO's initial approval or denial of the protocol following a rigorous investigation by
the entire community serving as the figurative risk assessment.
It ultimately relies on the same premise as Nexus protocol, namely that the community is accountable for
performing due diligence on projects and assessing their risk. Since the bulk of DeFi communities are
made up of average users and not security experts, it would be imprudent to base the entire Ease
protocol on the community's diligence.
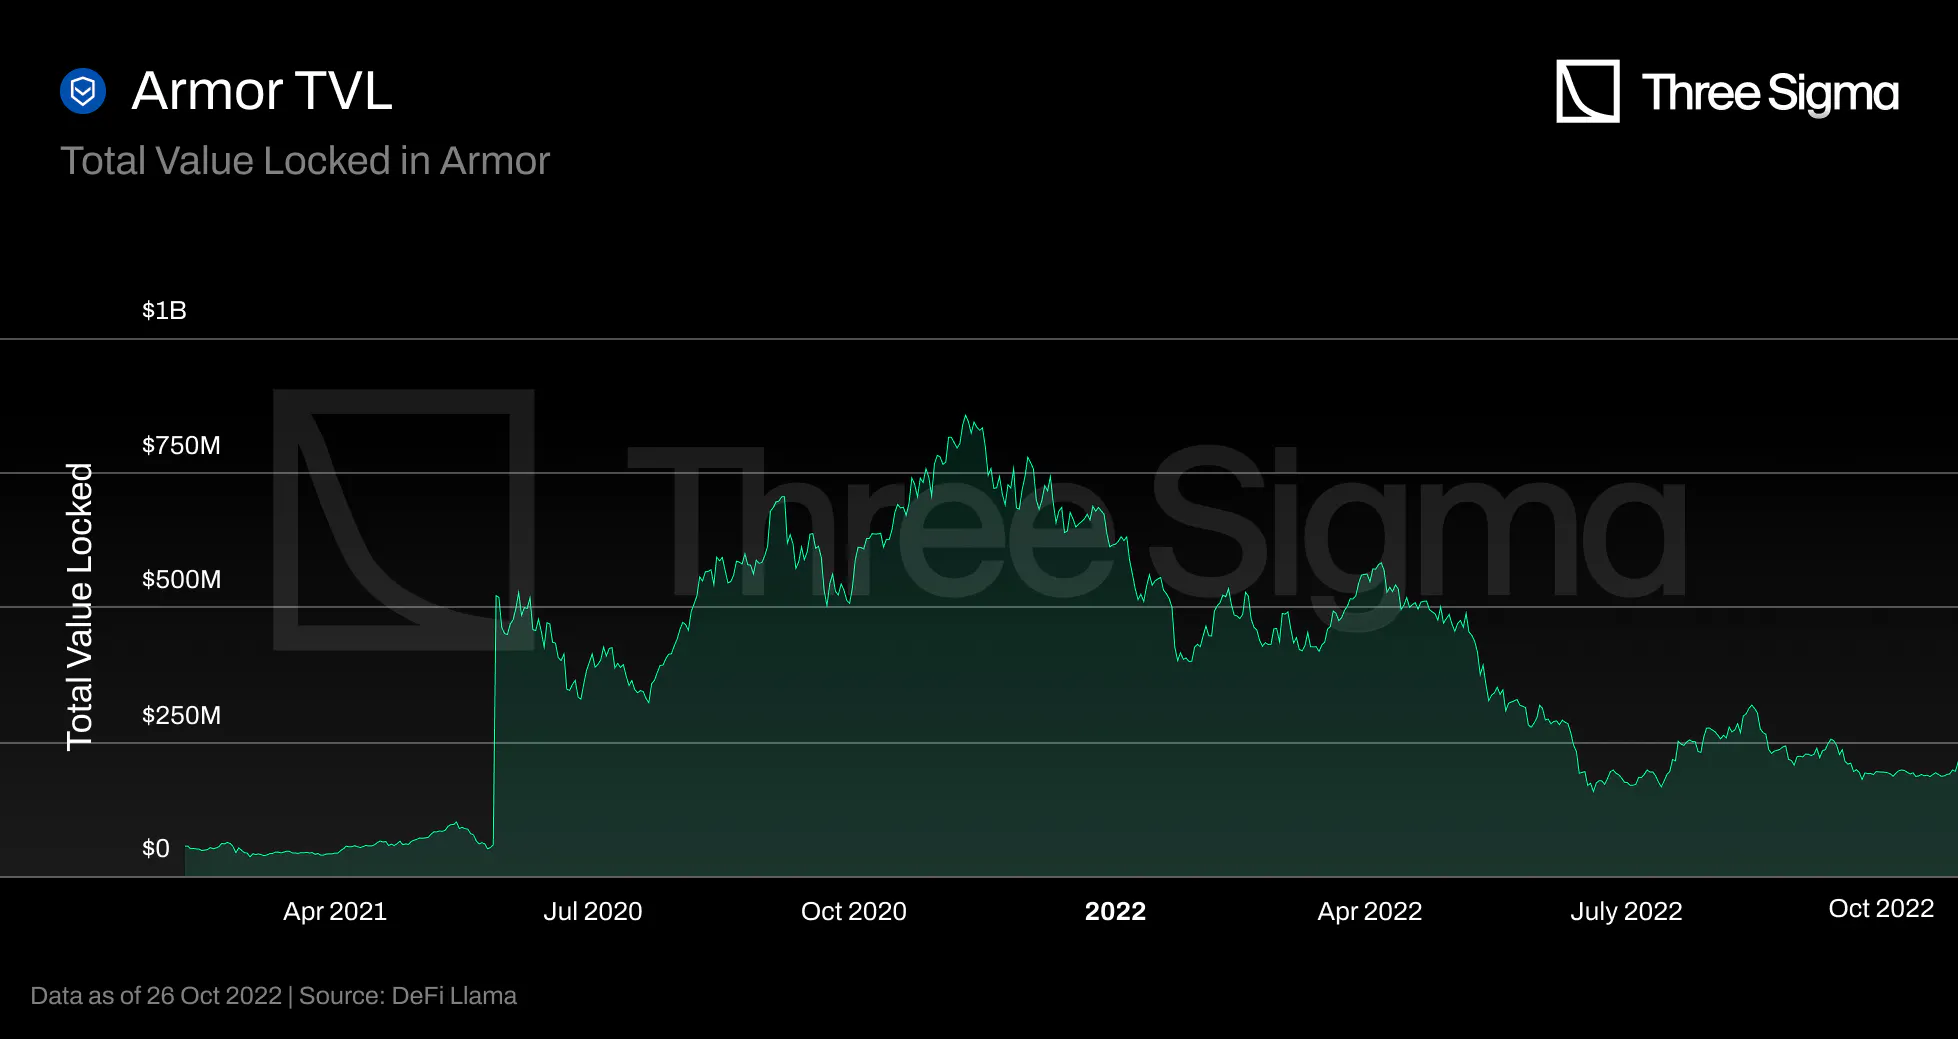
Adoption and TVL
DeFi Llama's Armor and Ease metrics are ambiguous. DeFi Llama incorporated Nexus into its TVL for Armor.
The team discovered this and contacted Defi Llama immediately, but they claimed to be unsure as to why
it was occurring, and it was never fixed.
Since the Ease launch in May, the only viable way to track Armor metrics is through their Dune Analytics
Dashboard, and based on the above chart, there are no longer any active covers in the protocol, since it
was discontinued.
DeFi Llama's presented metrics for Ease TVL are also invalid due to the lack of their legacy product,
arNXM, which DeFi Llama incorrectly counts as nearly $10 million for Armor TVL.
Since Ease was launched before there was a DeFi Llama metric page for it, the TVL has displayed 491k from
day one. Ease does not offer any official or community data dashboards. The Ease team had the
challenging task of launching a new and unique product during a bear market, which may explain why they
are having some trouble attracting liquidity.
TVC
In Ease, users deposit tokens in vaults to cover and provide coverage to other users. We can say that
Ease's TVL is equivalent to their TVC because all deposited funds are protected by other vaults. The
issue with this strategy is that if all protocols or even the vaults with the majority of value are
compromised simultaneously, the remaining vaults will not have sufficient funds to cover the defaulted
vaults. This relies on the same assumption that Sherlock uses, namely that the probability that multiple
high payout events occur within a short time span is very low. It would be interesting to see a deeper
analysis of this assumption and understand under which conditions it falls through. The way DeFi
operates in intertwined lego pieces that make up different protocols could pose a restriction to this
assumption in the sense that exploits in particular protocols could cause losses in others.
Revenue
RCA products are currently not generating any revenue. Revenue from prior Armor products such as arNFT
and arXM is currently enough to cover expenses. Ease.org does not currently charge any fees, but the DAO
will have the ability to impose a maintenance fee based on a percentage of the yields created by users.
This feature is not currently available. Ease is also working on Zapper integration, which will allow
clients to zap assets such as ETH, USDC, and others into Ease's vaults rather than having to provide the
exact underlying asset. This feature will be released from testing soon, and there will be a small fee
associated with it.
Final Thoughts
Ease's value proposition is based on the assumption that, on average, hacking losses are significantly
less costly than the premiums paid. We will be able to confirm this hypothesis once the project is
tested using actual exploits.
With this RCA business model, if a hack occurs in one vault, instead of the user paying a contract
premium, a small portion of the other vaults is liquidated to cover the loss, proportionally
distributing it throughout the ecosystem. The largest, most secure, and most robust protocols, and users
using these protocols have no incentive to participate in such a system because they are more likely to
pay for hacks in other protocols using this vault-shared architecture than to be hacked and receive
funds from other vaults. Even if the safest protocols are slashed less frequently, they will still be
slashed multiple times while the other protocols are hacked. This risk diversification seems very
beneficial for the system as a whole, as a large hack will never result in insolvency. However, proper
risk diversification only happens if there are a lot of different protocols and participants being
covered. One slight variation that could mitigate this would be to create different groups of vaults
with different risk categories. Riskier protocols could be grouped to share the same risk, or individual
users could then be better rewarded if they chose to provide the equivalent of their covered amount as
cover for a riskier protocol.
Also, relying on community decisions assumes that token holders can conduct extensive due diligence at
the smart contract level, which is beyond the knowledge of regular users. The safeness of each protocol
is determined by the community through Ease token delegation, which could, in turn, be a point of
failure if incentives are misaligned, i.e., if a large portion of voting power is gathered by a protocol
or user that could benefit significantly from deeming a protocol safer than it truly is.
Finally, assets in the ecosystem are the collateral for the ecosystem, meaning that the available
coverage increases as the ecosystem expands. Given that the risk is shared by all users and all vaults,
users are not genuinely insured in the conventional sense. Rather, they do not lose all of their capital
in the event of an exploit, only a portion.
Unslashed
Unslashed was launched on January 6, 2021, offering smart contract hacks, CeFi exchange hacks, stablecoin
depegs, oracle failures, and allowing users to create Capital Pools identical to those of the previously
described protocols, in which capital providers deposit ETH and their risk exposure are limited to a
single insurance policy. Capital Buckets, structured insurance products that limit risk across numerous
insurance policies, are also available.
Anyone may become a capital provider and provide risk coverage by allocating funds, which generates a
return and provides insurance coverage for the ecosystem as a whole. The return comprises three streams:
premium policies, the interest generated via Enzyme Finance, and the USF Capital Mining Program, which
enables the protocol to reward early adopters and users of Unslashed with the governance token via the
USF/ETH Uniswap pool.
Enzyme Finance is an asset management protocol that allows earning yield efficiently on the Capital
Supplied and can help increase the available Buckets Capital, therefore, increasing the amount of
provided coverage allowed.
Capital Suppliers receive premium payments live as they are directly streamed to them. They are not
locked in a specific policy for any amount of time, as they can leave a pool or bucket whenever they
desire and have access to liquidity to close the position.
Both capital providers and coverage seekers can trade their underlying tokens on external platforms, as
both positions are tokenized as ERC-20 tokens, improving their composability with other DeFi protocols.
Capital Buckets
A Capital Bucket is a collection of properly designed, analyzed, priced, and assembled insurance policies
for insurers to underwrite, diversifying their risk exposure.
The Spartan Bucket was the first structured capital bucket available on Unslashed. It protects users in
six centralized exchanges (loss of funds policy), two wallets, eight DApps (Smart Contract Protection
Policy), Chainlink oracle protection (oracle failure policy), Lido Finance protection (slashing
protection policy), three custodians, and four peg loss-related protections. The DAO can increase the
default maximum exposure by 5% per policy’s insurance capacity.
Cover Pricing
Unslashed has a pay as you go policy and users can stop the policy at any time, with payments being
calculated live. Pricing depends on several factors. Besides a fair pricing methodology applied to each
policy or policy type, Unslashed considers the correlations between policies that belong to the same
Capital Buckets. The pricing also takes into account loss distributions as it is done in traditional
actuarial pricing. The most recent policies include a supply and demand curve, allowing the premium to
vary with the utilization ratio.
The team states they have on-boarded quants from traditional finance and managed to build and calibrate
models that allow Unslashed to fairly price risk and structure insurance products. However, none of
these models are public and as such they bear natural intrinsic risks, i.e. trust is required.
Other than the factors that are considered to calculate premiums, there is no information on how the
calculation is done, how weights are assigned to each factor or whether this is a closed doors process
evaluated by the team or accept input by governance. Considering that Unslashed uses a pay as you go
model, this is most likely run off-chain. Another insurance protocol, Armor, implemented an on-chain pay
as you go policy, but had this had to be discontinued as Ethereum fees rendered it unsustainable.
Risk Cost
The minimum capital required corresponds to the maximum available cover. This is calculated by a
predefined formula that is not publicly disclosed. The design of the Capital Pools prevents withdrawing
capital or getting more cover if the corresponding action would result in the maximum payout exceeding
the maximum cover. Because the deposited Premium flows into the Capital Pool slowly over time, the
Maximum Available Cover does not change, but space can free up to either withdraw some of the capital
supplied or purchase additional coverage.
Unslashed considers that diversification across multiple smart contracts is not enough, as similar design
patterns may lead to similar attack vectors. For this reason the team chose to diversify the
Underwriters/Capital Suppliers risk across as many verticals as possible (smart contract risk, validator
slashing, exchange hacks, etc).
No more information could be found on the determination of the minimum capital required, nor on the risk
vectors integrated in cover pricing.
Tokenomics
USF is a governance token. Holders can vote on decisions regarding the direction of the protocol and
updates to the protocol parameters. The team will initially manage the protocol parameters and gradually
transition it to the Unslashed DAO.
Capital suppliers supply assets (e.g. ETH) to Individual Capital Pools and receive yield from the paid
premiums. These premiums are paid by Cover Buyers in the same asset (ETH). When instead someone decides
to deposit in Capital Buckets, they earn more types of yield: premiums, asset management yield and USF
capital mining rewards. Since USF is being rewarded for supplying capital and has no further utility,
sell pressure is created resulting in a constant decrease of the token value.
Claiming Assessment
A DAO-based claim assessment presents the challenge of choosing between the DAO's need to preserve the
capital of their mutuals and their conflicting obligation to spend the same money to pay valid claim
requests. Unslashed was one of the first decentralized insurance protocols to identify this issue and
adopt Kleros to arbitrate claims in a fair, transparent, and efficient manner.
In the case of a claimable incident, a user may submit a claim for reimbursement under the terms of the
policy. The claim request is followed by a time during which any user can contest the claim if they
believe it violates the claim policy. If no one contests the claim, it is approved and the payment is
made. If there is a dispute, a decentralized court case is launched in Kleros and Kleros jurors
determine whether the claim is valid or not. A claim can only be contested once, although it can be
appealed several times.
Before the UST Depeg event, only two claim requests were submitted to Unslashed. However, after the
event, more than eighty claims were filed. Unslashed's largest claim to date, a 742 ETH loss event,
caused by UST depeg, was rejected multiple times by the Kleros court arbitrating the case due to a 51%
attack.
Adoption and TVL
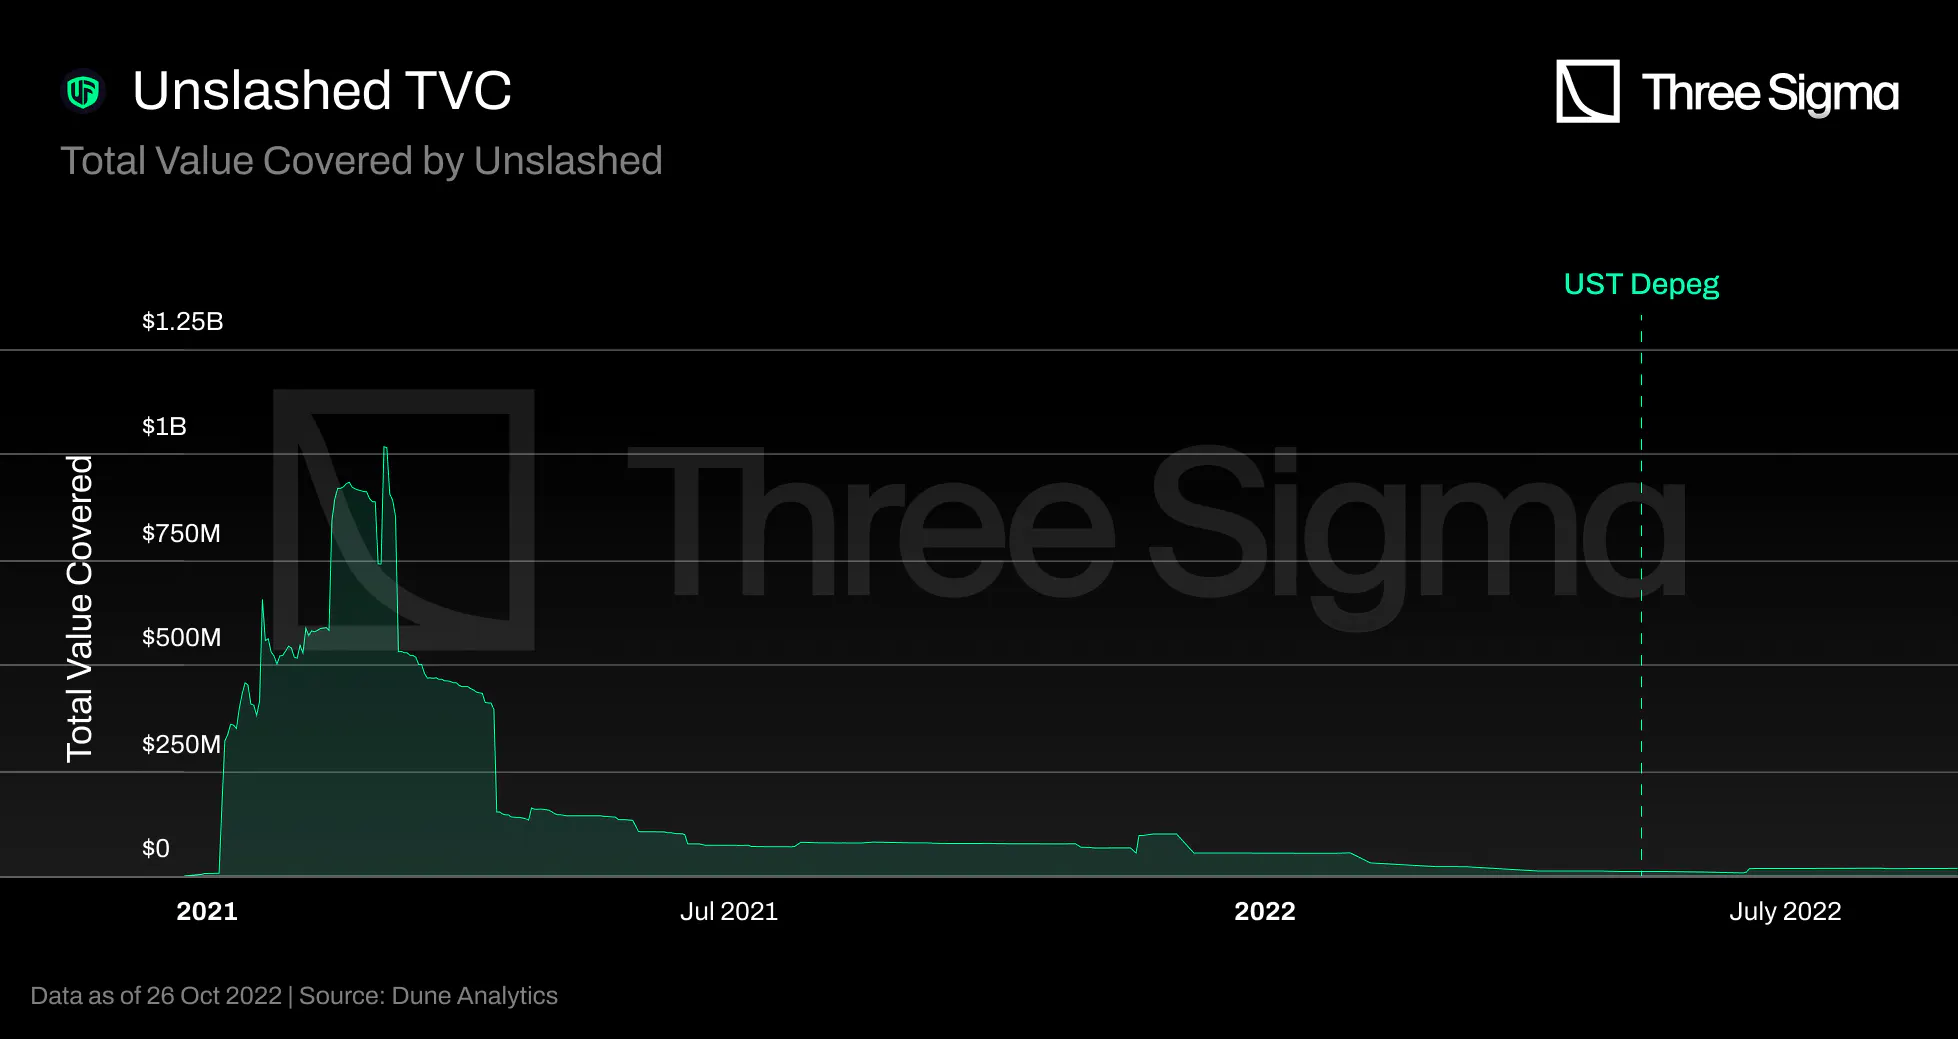
Unslashed's Total Value Locked (TVL) began at \$130 million on 14 March 2021 and peaked at approximately
\$169 million on 12 May 2021. Since then, Unslashed's TVL has been declining, reaching just under $23
million at the beginning of October.
At the time of Terra's collapse, Unslashed provided Stablecoins Depeg for UST users. As specified in
their UST De-Peg Cover Wording, the Unslashed UST De-Peg coverage was available for claim requests after
a 14-day Time Weighted Average Price (TWAP) of UST below $0.87. Unslashed paid more than 1000 ETH in
June, and the payments were made in multiple batches; therefore, the chart does not depict a sudden
decline in value, but rather a gradual decline throughout June.
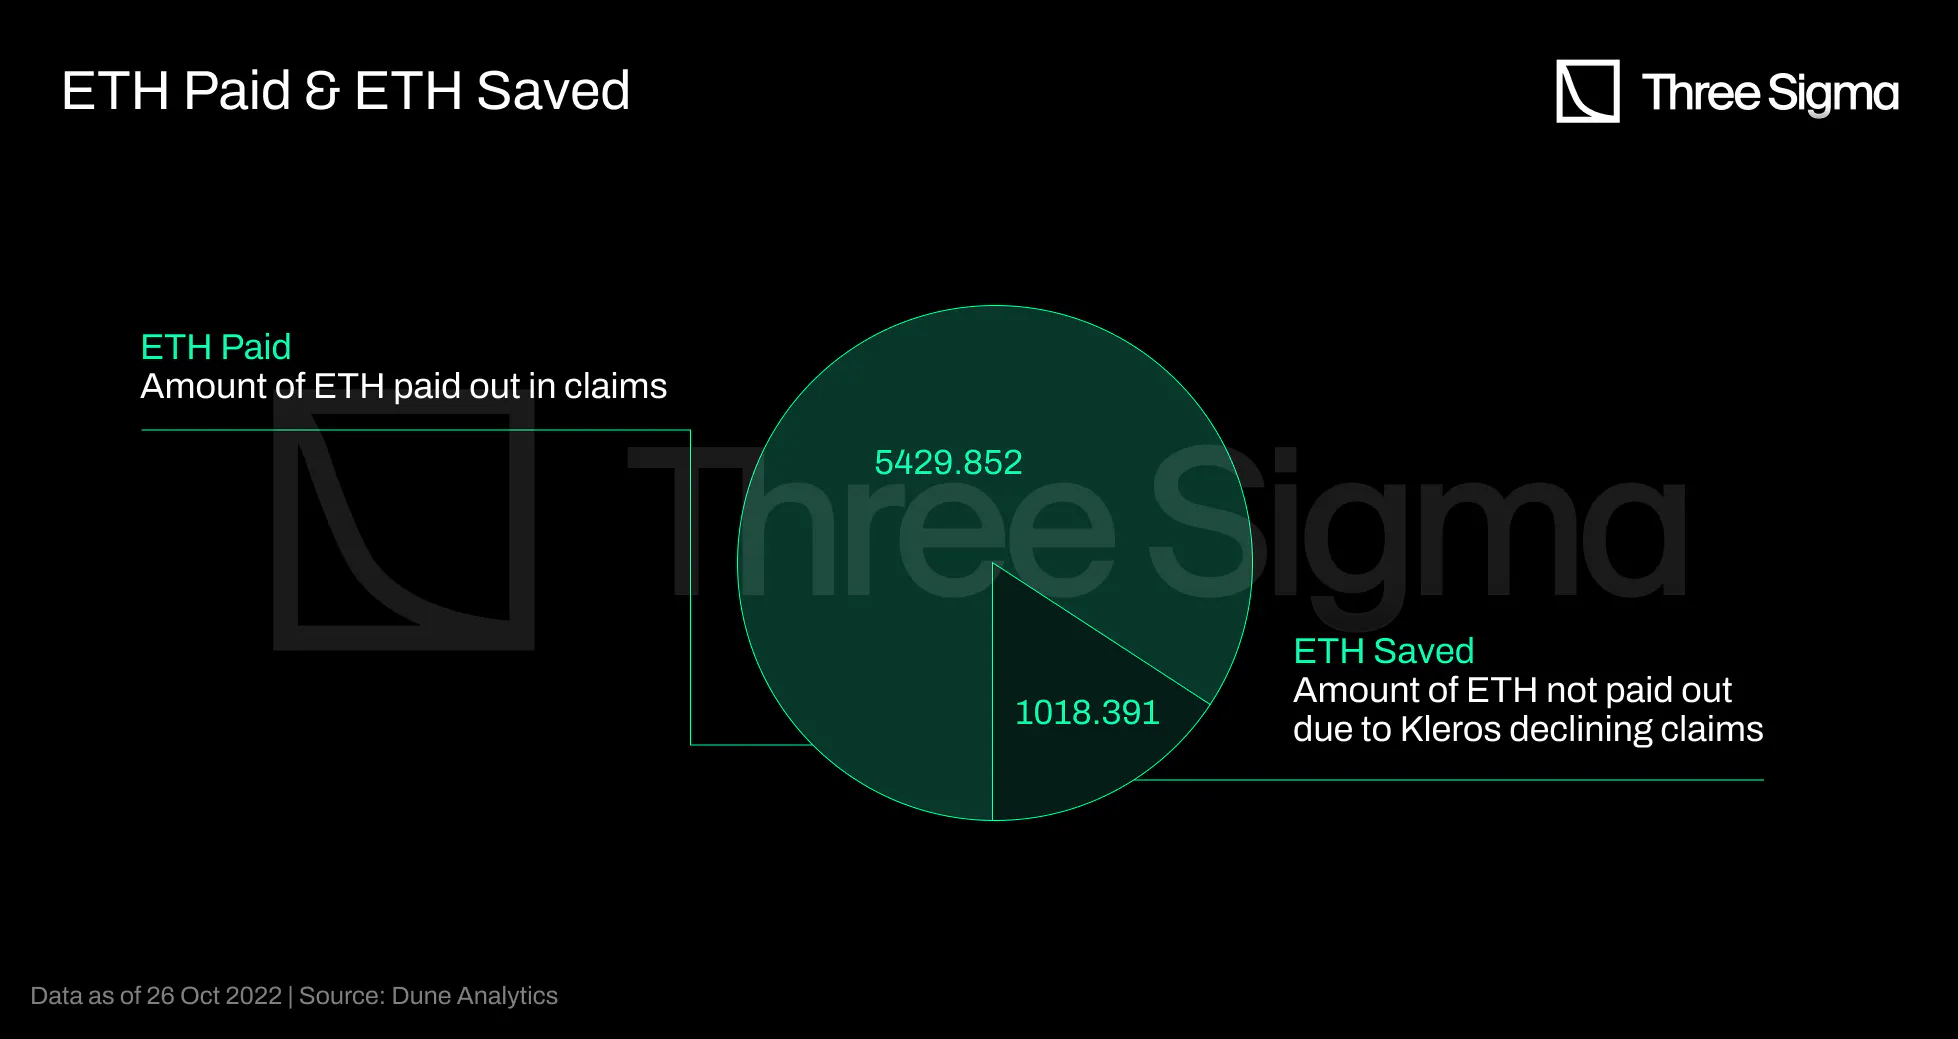
A total of 102 claims were ever submitted, and a total of 1018.391ETH were saved as a result of 7 claim
requests handled and refused on Kleros dispute, all of them were linked to UST Depeg.
TVC

Unslashed launched its product during a bull market fueled by the DeFi summer, which attracted a
significant amount of capital and cover insurance since customers were able to pay an additional price
to protect their assets. Close to 100 claims were submitted as a result of the UST depeg, and once paid
or denied, they expired, reflecting the subsequent drop in active coverage. Similar to any other
insurance protocol, Unslashed have struggled to return to their glory days following this catastrophe.
Revenue
There is currently no publicly available information regarding the Unslashed protocol's revenue stream or
similar statistics.
Since there is no current information on the revenue stream, no conclusion can be drawn.
Final Thoughts
Unslashed seems to prioritize partnerships with DeFi protocols and protect them against some of their
risks, instead of targeting users. Giving both capital providers and coverage seekers ERC-20 tokens that
represent their position allows other protocols to build on top of Unslashed and potentially create
added value. Another protocol could, for instance, issue risk-free tokens that combine a position and
the corresponding insurance. Users can also speculate by for example selling their premium tokens at a
higher price when there is lack of capital to offer more insurance.
NSure
After a Polygon beta, NSure launched on Ethereum in April 2021. NSure is conceptually similar to Nexus
Mutual in that it has a capital pool of multiple accepted assets and a surplus pool that accrues capital
through paid premiums. Unlike Nexus Mutual, however, it uses a Dynamic Price Model to determine
premiums, which vary across products in the marketplace based on real-time supply and demand. This
pricing model includes a Risk Parameter based on the rating assigned to each project by NSure. Their
current business model does not necessarily require KYC.
NSure Participants
Cover Providers can stake NSure tokens against protocols or custodians to underwrite insurance and earn
50% of premiums. Another 40% of premiums go to the surplus pool, and 10% is kept locked until the end of
the coverage to incentivise users to participate in the voting process if there is a claim request. The
rewards are proportional to the amount of capital the cover provider has locked into the pool.
On the other hand, Claim Assessors are members who stake NSure tokens to evaluate claims submitted by
other members and receive rewards for voting in conformity with the consensus.
Cover Pricing
Nsure employs a dynamic pricing model based on supply and demand to determine policy premiums.
The model employs the 95th percentile of a beta distribution (Beta(α, β)), and the shape parameters are
capital demand and supply. The premium is also influenced by a risk factor that accounts for the
project's level of security and a cost loading that accounts for claim settlement costs and other
internal expenses.
$$\text{annual premium} = max[\text{95th percentile of Beta}(α, β), \text{min prem factor}] × \text{risk
factor}$$
$$α= \text{outstanding policy limit (in USD)} × demand \, scale \, factor$$
$$β= staking\, pool\, (in\, Nsure\, token) × staking\, scale\, factor$$
$$policy\ premium\ = \ \frac{\text{policy duration}}{365} \times \text{annual premium } \times \ \lbrack
1\ + \ (\frac{365}{\text{policy duration }} - 1)*avg.\ claim\ cost\%\rbrack$$
The team recognizes that due to the lack of historical data on smart contract exploits, it is difficult
to apply traditional actuarial pricing to Nsure products. They argue that for transparency sake, it is
beneficial to use a supply and demand model that is easily verifiable.
Using a dynamic pricing model based on supply and demand means that if the capital supply is high, the
premium rate will be lower; if the policy cover demand is high, the premium rate will rise. Premiums are
susceptible to supply and demand forces; consequently, the weaker the supply and demand forces, the more
variable the premiums. This means that the more insured value there is in DeFi and in particular in
Nsure, the less sensitive premium pricing will be to demand and supply changes, which increases the
robustness of the insurance landscape. However, in the case of Nsure, the less the price is driven by
supply and demand, the more it would be influenced by a risk cost that is currently determined by the
team in a non-transparent way, which could be problematic.
The risk factor should account for the riskiness embedded in each project. Without this factor the
premium rate of two projects would be the same if their capital demand and supply were the same, which
is not ideal. However, finding a decentralized way to assess this risk factor would be an improvement.
Risk Cost
Nsure developed the Nsure Smart Contract Overall Security Score (N-SCOSS), a 0 to 100 rating system for
determining the risk cost for every project.
N-SCOSS is based on five major characteristics that, according to Nsure, make up the possibility for a
protocol to suffer an exploit or bug in the code. These are the following: History and Team, Exposure
(aka TVL, Industry Segment), Audit, Code Quality, and Developer Community. The team assigns a weight to
each category and performs due diligence on each project by rating each category.
The formula used to calculate the N-SCOSS is as follows:
$$N − SCOSS = \sum_{i=1}^5 wi ⋅ Ni$$
$$N_i =\sum_{j=1}^{k_i} w_{i, j} ⋅ N_{i, j} (0 ≤ N_{i, j} ≤ 100)$$
where Ni (i = 1, ...5) are the five pillars of N-SCOSS and wi is the weight attributed to each. These
pillars are further subdivided into several separately analyzed rating factors, symbolized by Ni, j.
Weights are assigned to each pillar and each rating factor to quantify its relevance towards the code’s
security.
To develop this system, factor groups that logically impact the code security were selected. Then
historical hack events data were mapped to those selected rating factors, and the team analyzed whether
they are correlated. The significantly correlated factors were included in the final calculation of
N-SCOSS.
The pillar of History & Team considers the following sub-factors: project age, past exploits (if any),
team anonymity and team experience in programming. The Exposure factor entails: total value locked,
industry segment and infrastructure. The Audit factor is measured by audit transparency and scope, audit
findings, audit firm trust score and other credits. Code Quality is assessed through documentation and
testing. Finally, the Developer Community factor takes into account bug bounty programs and issues
raised on Github.
The team points to some improvements that could be made to the system, such as introducing an adjustment
variable to credit for strengthening or penalizing something that may not have been captured within the
5-pillar structure. Another future improvement mentioned by the team refers to the data sources. Nsure
has been using data from sources such as SlowMist Hack Zone, DeBank and DefiPulse, but wants to set up
an automatic data feed into the rating model via external data aggregation, minimizing manual
interference. This could minimize centralized judgment and in the future make N-SCOSS an auto-generated
indicator for users' reference. This concern to make Nsure risk assessment more transparent, unbiased
and available for all is definitely a step in the right direction. Another potential improvement would
be for new factors to be added through governance, as well as the corresponding weights.
Minimum Capital Requirement
Naturally the safest way for an insurance company to guarantee they can always pay out all the claims,
would be to hold 100% cash against total obligations. However, the fact that the probability of
occurrence of these events is low and the possible diversification of risk allows insurers to use the
capital provided more efficiently. Nevertheless the primary concern of the insurance capital model, as
seen also in Nexus Mutual and InsurAce, should be to calculate the capital required to guarantee
solvency of the risk pool to a high confidence level like 99.5% in the EIOPA’s Solvency II framework.
The Capital Model is used to determine the Minimum Capital Required (MCR), which is used in the minimal
capital required to be locked in the Capital Pool and in the Staking Power Used in the Underwriting
Module.
The Minimum Capital Requirement, i.e. the minimum amount of capital Nsure needs to have in order to
guarantee payouts for all claims at a high confidence interval, it is calculated as follows:
$$MCR = \sqrt{\sum_{i, j} \operatorname{Corr}(i, j) * R F(i)^* E X(i)^* R F(j) * E X(j)}$$
where RF is the risk factor for product i and j, EX is the total exposure for product i and j, and
Corr(i, j) is the correlation between product i and j.
Reflecting the correlated risks when considering the MCR is something not all insurance protocols do and
it seems sensible. There are a few factors that could indicate the existence of correlation in terms of
risk between projects in DeFi, for example: projects that result from forks or refer to existing
projects’ code, similarity in structure as projects of same business type tends to be vulnerable to same
hack method, projects that share oracles and naturally the lego structure of DeFi.
Tokenomics
NSURE token is a utility token used by Nsure participants and can only be used on Nsure Network. NSURE
fuels platform operations such as voting on claims and governance-related functions. Additionally, the
token is used for staking and signaling the perceived risk of the different platforms covered by Nsure.
NSURE tokens will be issued as incentive for capital providers participating in the Capital Pool with
their assets. The rewarded NSURE can be used to stake on the insurance contracts, acting as underwriter
within the platform, to provide further capital and share part of the premiums collected. 40% of all
premiums are distributed between participants in the underwriting pools. This mechanism was expected to
act as a natural balance, attracting new participants in order to match the demand, providing the needed
capital and capacity to attract even more users. However, it is worth noting that rewarding underwriters
with 40% of premiums is on the low end of what can be seen in other insurance protocols, where
underwriters are rewarded with 50% or more. If liquidity incentives are not enough to outweigh the risks
of underwriting, the total value locked in the capital pool can not be enough to cover claims. This can
take a turn for the worse as insufficient capital in the capital pool disables withdrawals, which can in
turn disencourage new deposits, making it difficult to move out of the situation.
Claim Assessment
The assessment is carried out through a decentralized decision-making process where 5 claim assessors,
from those who have staked a sufficient number of tokens, are randomly assigned for each claim. This
prevents people from abusing their power or manipulating the system. During the claim evaluation
process, the staked tokens will be locked and destroyed if the assessor comes to a different conclusion
about the claim than the majority. A challenge procedure and a subsequent public vote after a successful
challenge contribute to the fairness of the claim evaluation procedure.
Each user can submit one first free claim on their policy. If the claim is declined and the user wants to
file another claim on the same policy, they have to pay a fee worth 10% of the policy premium. After a
claim is submitted, the 5 claim assessors are randomly chosen and to avoid potential conflicts of
interest, the policy premium is unknown. Both the users and NSure holders can dispute the final
decision. A disputed case with sufficient stakes will end in a public vote, the ultimate verdict for the
claim, with no more disputes allowed.
Adoption and TVL
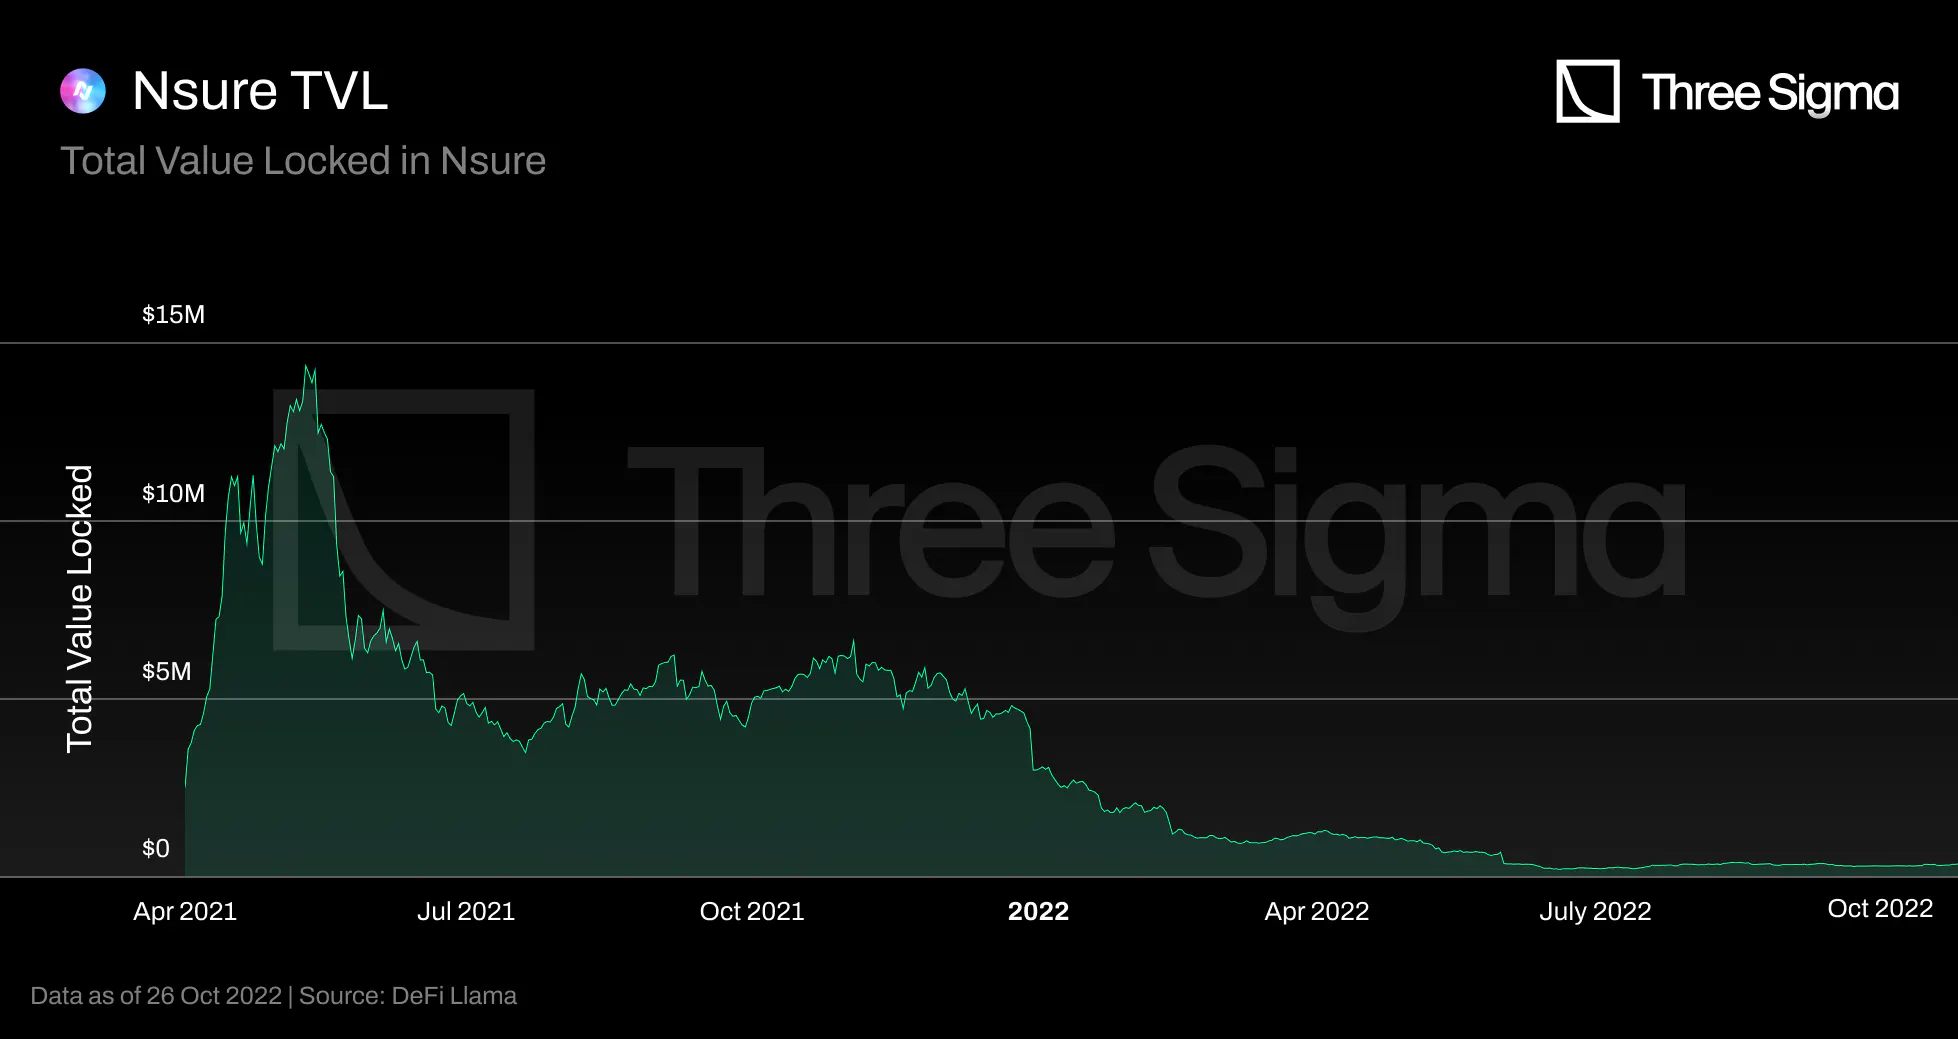
Adoption has been difficult for Nsure. Its TVL quickly peaked after launch, reaching a maximum TVL of
roughly \$15m and currently sitting at around \$360k.
TVC
The protocol's active value is around \$50.8k, around 14% of current TVL. 92% of the active coverage
(around \$46.8k) is to protect users against a Compound V2 exploit, while the remaining value is to
protect users against a KeeperDAO exploit.
This data was gathered from the protocol's analytics website, however it is possible it needs updating.
According to the analytics page, only two of the 27 available pools are being used to protect users. If
the information is genuine, the Capital Efficiency Ratio of the protocol is quite poor, as only 50,8k,
from a total of 360k TVL, are used to provide user coverage. It was not possible to further investigate
this, as the team is not active on Discord and does not seem available to answer questions.
Revenue
The protocol is anticipated to generate \$1,600 a year in premiums. While Nsure offers a page with
metrics, the revenue table appears to not be working properly at the time of writing of this report. It
is also important to note that the last policy was purchased on December 17, 2021, suggesting that
either the website charts need to be revised or there is a general lack of acceptance for NSure as an
insurance provider in the DeFi space, which would explain its extremely low TVL.
Final Thoughts
Despite having a dynamic pricing mechanism that should have helped align supply and demand, it is obvious
that Nsure has not been able to obtain a significant and steady market share. As liquidity incentives
dried up, it is likely that market players' willingness to deposit have decreased, as the risks vastly
outweigh the rewards in the form of inflated token payments. If there is insufficient capital to cover
the claims, users' tokens could be locked in the capital pool indefinitely (or for an extended
duration). Lastly, it is unknown whether the capital, price, and risk models are performed on-chain or
off-chain, as well as the weighting of certain parameters.
However, the randomly selected claim assessors and the non-disclosure of the claim amount were excellent
concepts for preventing the conflict of interest inherent in Stakers-as-Underwriters systems such as
NSure.
Risk Harbor
Risk Harbor, launched in May 2021, defines itself as a risk management marketplace that protects
liquidity providers and stakers from smart contract risks, hacks, and attacks via a fully automated,
transparent, and unbiased invariant detection method. In other words, it offers parametric protection
over on-chain verifiable metrics, thus excluding off-chain attack vectors such as frontend attacks. As
implied by its name, parametric insurance establishes parameters that determine payouts based on
specific metrics. Underwriters establish risk management pools with predetermined parameters, and users
choose which pool to purchase coverage from.
Risk Harbor Core and Risk Harbor Ozone are its two major parts. The Core module is a native-EVM Risk
Harbor compatible with chains such as Ethereum, Avalanche, and Arbitrum, among others. The Ozone module
was created on Terra and operates on the Cosmos ecosystem.
One of the problems faced in insurance is the fragmentation of capital, where the underwriters need to
actively manage their capital and select which protocols and products they’d like to underwrite. Risk
Harbor Core attempts to tackle this by creating underwriting vaults where many protocols can be covered.
The funds deposited in the pools are locked until expiration, which can be a barrier to attract capital.
Deposits in DeFi systems are frequently represented by claim tokens that are minted when deposits are
made and burned when the underlying funds are withdrawn. Risk Harbor's automated claims evaluation
method compares the redeemability of credit tokens with the protocol that issued them, analyzing
important protocol-specific invariants.
Risk Harbor Participants
Underwriters supply capital to cover a potential user's loss in the event of a protocol vulnerability in
exchange for upfront premiums and the compromised token in the event of a claim. Anyone can become an
underwriter by supplying capital in one of the pools, if they are willing to assume the risk. When
providing coverage, underwriters determine the Price Point at which they are willing to accept risk and
deposit capital into the pool. They may remove their unutilized capital at any moment. If underwriters
are unable to completely withdraw their position, it is because someone has purchased protection against
it.
After deciding to withdraw their assets from the pool, underwriters must wait 12 hours due to the
withdrawal cooldown that was implemented as a safeguard against MEVs and front-running. After the
cooldown period, users have 12 hours to complete the withdrawal; otherwise, they must begin the process
again.
Similarly, users who are willing to pay a premium can purchase a policy to protect themselves against
vulnerabilities in DeFi protocols.
Cover pricing
The cover pricing is determined by the AMM that takes into account market conditions and protocol risk to
calculate protection pricing automatically. When underwriters deposit funds to the pool, they pick a
Price Point at which they are willing to assume risk. The Price Point is the proportion of the overall
underwriting amount a potential user will pay in advance when buying protection from the protocol. These
premiums would flow to the underwriters who had deposited funds at the chosen Price Point.
Users searching for coverage monitor the available pricing points and purchase at any Price Point with
sufficient unused underwriting capital. If the consumer desires more coverage than the one available at
a single price point, they can split their order across multiple price points.
The price depends on a variety of things. First among these are the assessed hazards of the protocol for
which protection is being sold. Risk Harbor’s team decides how to weigh those hazards before feeding
them to the AMM. The second factor to evaluate is the amount of outstanding protection that has been
sold. Risk-averse, the protocol prefers to spread its liabilities. This means that if protection on a
certain pool is in great demand, the AMM will propose a higher price for protection on that pool. This
works in a similar way to dynamic pricing based on demand and supply, which is seen in various insurance
protocols. Likewise, if the protocol feels it bears commitments that are connected with the protection
you are attempting to purchase, the price will be higher because the protocol is risk-averse.
Risk aversion is a characteristic at the vault level that aids in AMM price protection. Higher risk
aversion parameters indicate that protection costs increase more rapidly, whilst lower risk aversion
parameters indicate that protection costs remain closer to actuarially reasonable rates.
A risk-on vault, for instance, indicates that the vault is not particularly risk-averse. Risk-on vaults
are appropriate for underwriters with a high risk tolerance, such as large, diversified hedge funds and
DeFi power users with powerful arms. A risk-off or conservative vault is preferable for underwriters
with a reduced risk tolerance, such as DAOs and pension funds.
Risk cost
The risk model is one of the inputs of cover pricing. The risk cost is expected to follow the probability
distribution of default occurences, informing the AMM of the likelihood of a default event occurring on
each of the vault’s pools. The risk model also includes the correlation between different occurrences,
as is the case for some insurance protocols like Nsure.
There is no information as to how these probability distributions are derived, nor whether this is done
on-chain or off-chain.
Tokenomics
There is no Risk Harbor token (26 October 2022).
Claim assessment
Risk Harbor's claim assessment is reasonably easy and independent of community voting. The user confirms
a claim token transfer, provides credit tokens (e.g. cUSDC) to the Underwriter Contract, and the code
verifies the validity of the claim before sending the claim tokens to the underwriters and the payout
from the underwriting funds to the user. Before assuming that a claim is legitimate, it waits at least
one block (to prevent flashloan attacks) and then verifies its validity.
The automated claim evaluation procedure monitors the evolution of public system state variables directly
on-chain to evaluate whether or not a claim should be paid out. These variables vary between protocols;
hence, they must also vary between Policies. For example, the ETH in Compound Policy tracks the ratio of
outstanding claim tokens (cETH) to USDC. However, the same would not make sense for a protocol covering
USDC in AAVE, therefore the system would track distinct state variables.
Automated claims assessment is impartial, scalable, and faster than governance-based processes, however
currently possible to achieve only for parametric insurance.
The UST Depeg
Compared to InsurAce and Unslashed, Risk Harbor's coverage protection for UST depeg events was superior.
In InsurAce, customers were required to wait for the Time–Weighted Average Price (TWAP) 10-day average
to fall below \$0.88, whereas Unslashed required users to wait for the TWAP 14-day average to go below
\$0.87. In Risk Harbor, reimbursement occurred when the UST price on Chainlink fell below $0.95,
allowing holders to automatically exchange their wrapped aUST for USDC.
The protocol worked as expected since an it was able to automatically detect the UST depeg and the claims
were also automatically paid once there was unused liquidity in the pool.
Revenue
As of 26 October 2022, there are no fees incorporated in the protocol.
Adoption and TVL
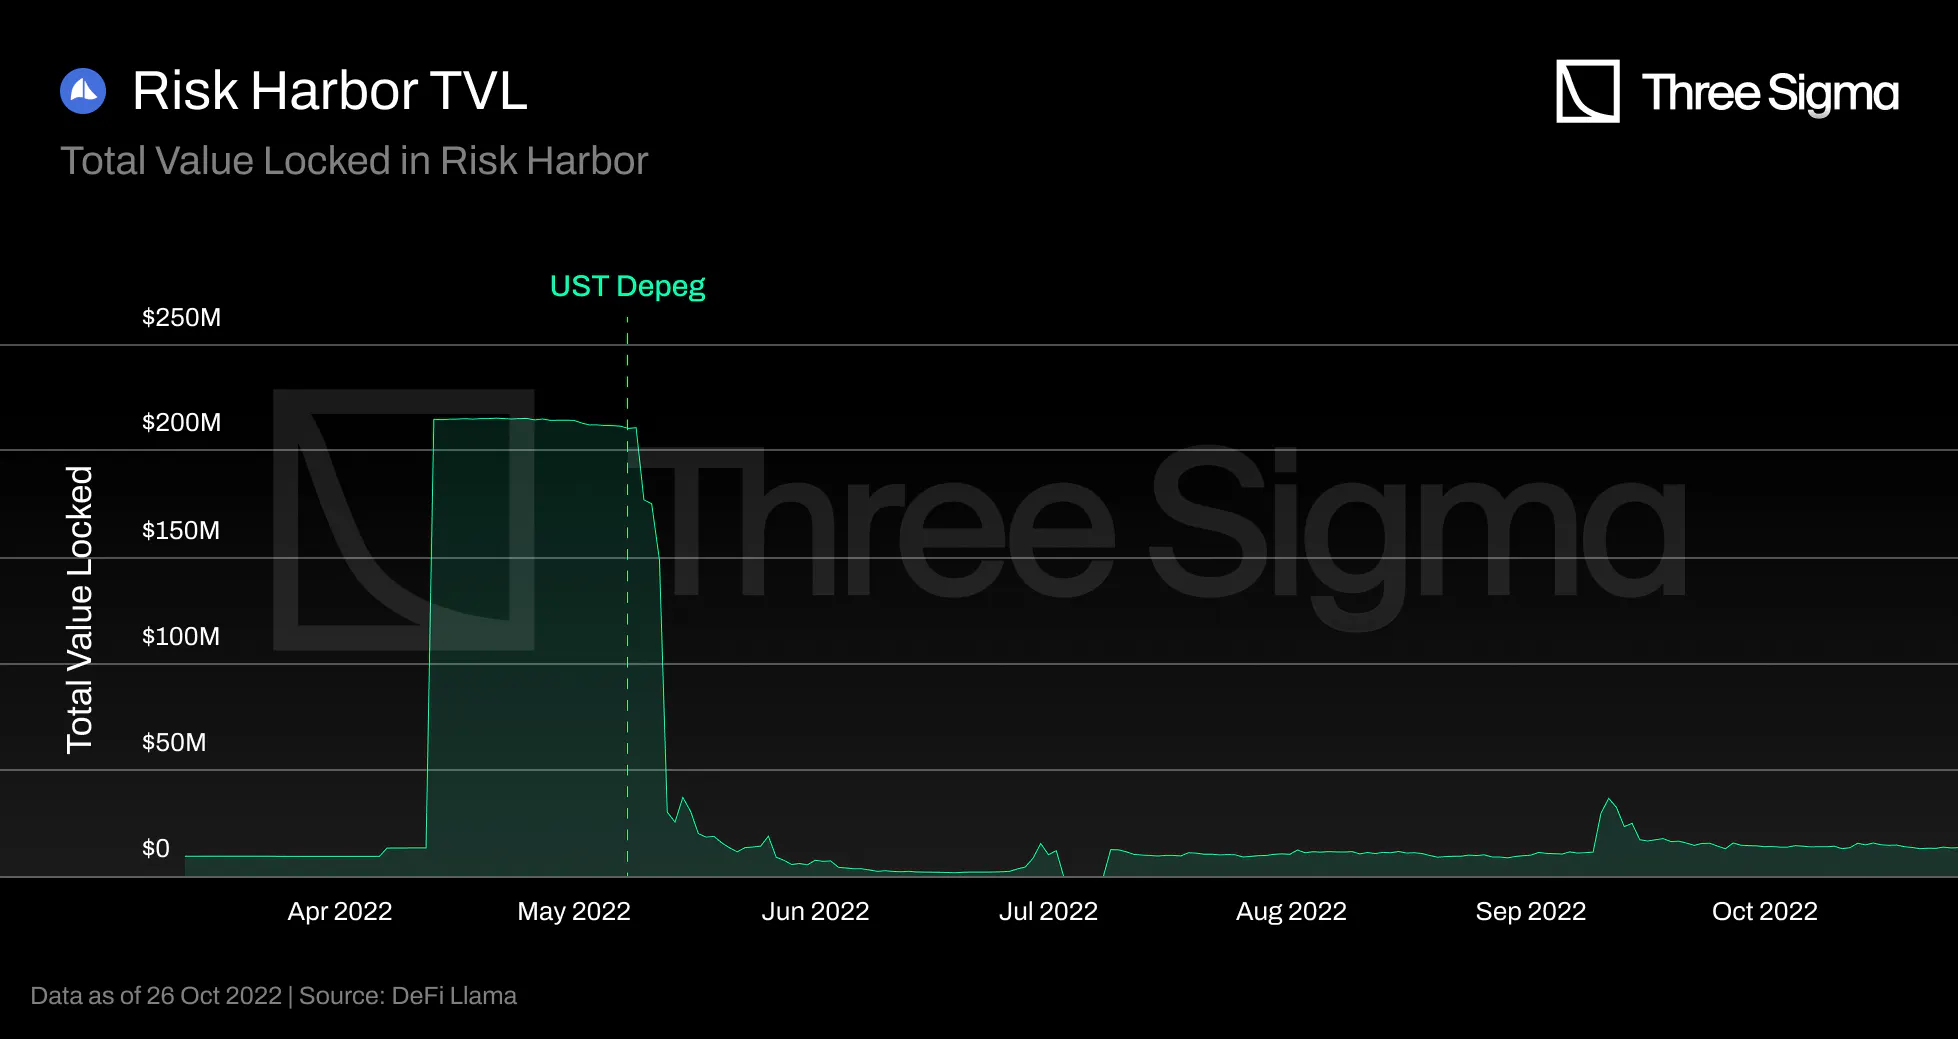
Despite launching on EVM-compatible chains, its adoption has lagged. Out of the current \$14.5m in TVL,
\$14m is in Terra2 and \$410k on Arbitrum.
Risk Harbor was fairly popular in the Cosmos ecosystem before the UST Depeg event. As can be seen in the
chart, after the Terra/Luna collapse, the TVL took a big hit, mainly as Luna and Luna's native tokens
spiraled out of control to ~$0.
The UST depeg vault on Risk Harbor had a coverage of $2.5m before its collapse. Therefore, as soon as the
UST price went under \$0.95, policyholders were allowed to swap their distressed assets (UST) for USDC.
Additional information about that can be found here.
It is important to note that only some UST pools on Risk Harbor covered stablecoin-depeg risk.
TVC
Risk Harbor doesn’t have an analytics dashboard yet.
There is currently no publicly available information regarding the Risk Harbor protocol's TVC or similar
statistics.
Since there is no current information on the TVC, no conclusion can be drawn.
Final thoughts
Parametric insurances are a double edge sword. On one hand, they provide quick payouts over predefined
parameters. On the other hand, they lack enough flexibility to be able to cover complex events or where
a moral hazard exists.
Risk Harbor doesn’t fragment the liquidity of policy covers, rather liquidity is unified under a single
pool. This is great at protocol level as new products/protocols can be covered without needing to
bootstrap additional liquidity. However, this implies that liquidity providers need to fully trust the
decisions taken by the protocol.
Risk Harbor implemented a pretty innovative automated claims assessment that allows impartial, scalable,
and faster than governance-based processes.
The cover pricing mechanism is very innovative and could be an interesting new alternative. However, no
information could be found regarding how the default occurrence probability needed for the risk cost is
obtained nor how the risk cost is integrated into the cover pricing, so that a more in-depth analysis is
not possible.
Bridge Mutual
With the stablecoin market cap just over $23 billion, Bridge Mutual announced its protocol in November
2020, and launched on July 9th 2021 with no-KYC, permissionless creation of coverage pools,
portfolio-based insurance coverage, and underwrite policies with stablecoins in exchange for an
attractive yield. In August 2021, fourteen days after the Popsicle Finance hack, it paid out its first
claim.
In February 2022, Bridge Mutual released V2 with capital efficiency improvements, leveraged portfolios,
which allow users to underwrite insurance for multiple projects simultaneously for those willing to
assume higher risk for a higher APY, and Shield Mining, a novel feature that allows projects and
individuals to contribute X tokens to the Project X Coverage Pool in order to increase the pool's APY
and attract more liquidity. It also introduced the Capital Pool, an investment arm of Bridge Mutual that
invests unused capital into third-party Defi protocols and generates revenue for the vault and token
holders.
Covers
On Bridge Mutual anyone can create a coverage pool for any smart contract, exchange or listed service in
exchange for yield. To do so a user just has to choose the appropriate network, enter the corresponding
contract ID for the token of the project and deposit an initial amount of capital in USDT. Projects that
are confident in their security can incentivize Coverage Providers by providing protocol tokens as
additional rewards that get distributed to. This is known as Shield Mining. Shield Mining is a good way
for projects to increase the amount of coverage available in their Coverage Pool.
Users who want to buy coverage, the Policy Holders, pay for coverage using USDT. This differs from other
insurance protocols like Nexus Mutual, where all payments are in ETH and even NXM value is strongly
influenced by ETH. The approach of Bridge Mutual seems more market neutral and can be less volatile in
bad market conditions. It is, however, interesting that only USDT is accepted and not other stablecoins,
like USDC.
Bridge Mutual also provides coverage for stablecoins as a different product within the platform. This
protects against loss of value caused by a de-pegging event.
Pools
There are three types of pools in Bridge Mutual: The Coverage Pools, the Capital Pool, and the
Reinsurance Pool. Both Capital and Reinsurance Pools are internal pools, which means that users cannot
directly interact with them. Their goal is to enhance the protocol’s usability and capital efficiency.
For each covered project there is a corresponding Coverage Pool. Like described before, USDT must be
deposited into the pool by its creator and the protocol can choose to provide additional incentives.
USDT deposited in these pools is deposited into the Capital Pool, where it is used to earn passive
income for BMI stakers and the protocol. The Capital Pool sends USDT to yield generation platforms with
low risk. It is responsible for coverage liquidity withdrawals, policy payouts, and investments. It is
rebalanced daily to guarantee operations and payouts.
The Reinsurance Pool is a protocol-owned vault that acts as an internal coverage provider to de-risk the
protocol. It acts as a de-facto Leveraged Portfolio with key differences: it uses only protocol-owned
funds, has a lower risk profile, and receives a lower APY from Coverage Pools (it receives APY
comparable to those of a regular Coverage Provider, while at the same time being exposed to risk similar
to those of a leveraged portfolio). The Reinsurance Pool accumulates the yield generated by the 3rd
party protocols and re-introduces it to the Capital pool. It effectively increases the supply of cheaper
coverage on selected pools and increases capital efficiency.
Tokenomics
Members stake USDT against protocols or custodians and get back bmixCover. Like in Nexus Mutual, a stake
against a protocol is seen as a vote of confidence, showing that they think a protocol is secure.
Stakers earn 80% of premiums paid, while the remaining 20% goes to the Reinsurance Pool as a protocol
fee. This part of premiums that go to stakers is larger when compared to other insurance protocols that
only give 50% of premiums to cover providers.
Coverage providers can also stake bmixCover in the staking contract pool in order to receive additional
BMI rewards. They are issued a BMI NFT Bond that represents the amount of USDT staked. These are
interest and risk bearing assets that represent the USDT deposited in a coverage pool. They are
tradeable and can be sold on any NFT marketplace. This potentially adds value to cover providing, since
the provided assets are not locked, but can still be used in a more capital efficient manner.
Users can also do what Bridge Mutual calls “Native BMI staking”. In this case a user stakes BMI in the
BMI Staking Contract, and BMI rewards are compounded automatically onto the principle. When a user wants
to withdraw these tokens from the contract, they must submit a request and wait 8 days. After these 8
days the user has 48 hours to withdraw their tokens. If after these 48 hours the user still wasn’t
withdrawn, another unstake request must be submitted and the 8-day waiting period resets. As proof of
their staking position the user receives stkBMI, which are in turn tradable tokens. Current native BMI
staking is redistributing tokens at the rate of 1 BMI per block. The APY is naturally dependent on the
total amount of BMI staked in the pool.
StkBMI can also be used to vote on claims by locking them in the voting contract.
Withdrawal periods are usually seen as a drawdown by users. However, voting with the majority also gives
out rewards in terms of reputation (which in turn increases the next rewards), BMI tokens and USDT.
Hence, if these rewards are meaningful then natively staking BMI is the only way to participate, which
can make the withdrawal period seem negligible. This interconnects the value of the BMI token with the
willingness to participate in the protocol.
Incentivization of capital provision doesn’t only come from BMI, but can also come from the protocols’
own tokens, through Shield Mining.
Investments
The Capital Pool only makes investments in the most well-known, tested, and liquid protocols. However, it
naturally adds some risk to the protocol. Coverage providers do not directly get a share of the yield,
but the yield is entirely deposited in the Reinsurance pool, therefore decreasing the risk exposure of
coverage providers and reducing the price for police holders, effectively creating a win-win situation.
Later, the DAO will be able to decide on other outcomes for this yield, such as BMI buybacks from
exchanges.
Premium Pricing
Like InsurAce, Bridge Mutual uses a dynamic price model based on the utilization ratio, i.e., supply and
demand of a cover. The considered variables are the utilization ratio of the pool, the duration of the
cover, and the amount covered. As each of these go up, the price of coverage also goes up.
While both InsurAce and Bridge Mutual use dynamic pricing models, they differ in how they are
implemented. InsurAce uses aggregate loss distribution models to calculate a base premium, which is the
premium used while the utilization ratio is less than 65%, and then uses a dynamic pricing model. Bridge
Mutual establishes a minimum (1,8%) and maximum (30%) premium. An utilization ratio above 85% is
considered risky for the protocol and as such, the pricing of the premium increases more rapidly.
The risk cost for Bridge Mutual is the utilization ratio. A high utilization ratio implies that many
users are willing to take insurance against the project, and few are ready to provide coverage, hence
the project is considered risky. However, these pools charge higher premiums and hence have a higher
APY, which can drive the utilization ratio down. There is directly no other evaluation of risk other
than the Utilization ratio. However, the funds from the Reinsurance pool are used to decrease the price
of coverage by padding the Utilization Ratio, using algorithms based on the pool’s risk profile
determined by the DAO.
Minimum Capital Required
To ensure there is enough liquidity in a pool to pay all outstanding covers, coverage providers are
forced to wait 4 days before withdrawing their USDT after a withdrawal request. They can only withdraw
up to the amount that pushes the utilization ratio of the particular coverage pool to 100%. Withdrawals
are also only possible when there are no active claims against it. This can potentially create a poor
user experience for projects with small coverage pools.
Claim Assessment
For Stablecoin, the claims are automatically settled, without requiring voting. For the remaining claim,
the Bridge Mutual Claim Assessment is a three-step procedure. The initial phase lasts seven days, during
which users can vote to accept or reject a claim based on their own research and the evidence of loss.
Voting is only considered valid if at least 10% of all staked stkBMIs participate in the voting process.
In the second step, users must confirm their votes within seven days; those who fail to do so will incur
a 100% penalty on their staked BMI position. Claims are only accepted if at least 66% vote in favor of
acceptance; otherwise, they are rejected. The final step occurs two weeks later, and the user who
submitted the claim has four days to disclose the result of the vote.
Every user's Reputation Score begins at 1.0 and can range between 0.1 and 3.0. Underwriters voting with
the majority are rewarded, while those voting with the minority suffer reputation loss, and those voting
with the extreme majority get slashed by 10%. The reputation score is calculated based on the stkBMI
amount used for voting and is updated for each claim voted.
This process, like all the other Stakers as Insurers Insurance Models, represents a conflict of interest,
requires community on-chain analysis, smart contract security, and exploit expertise that regular users
lack, it's a super slow process, and in the end it does not even provide a means for a user to dispute
the decision.
Adoption and TVL
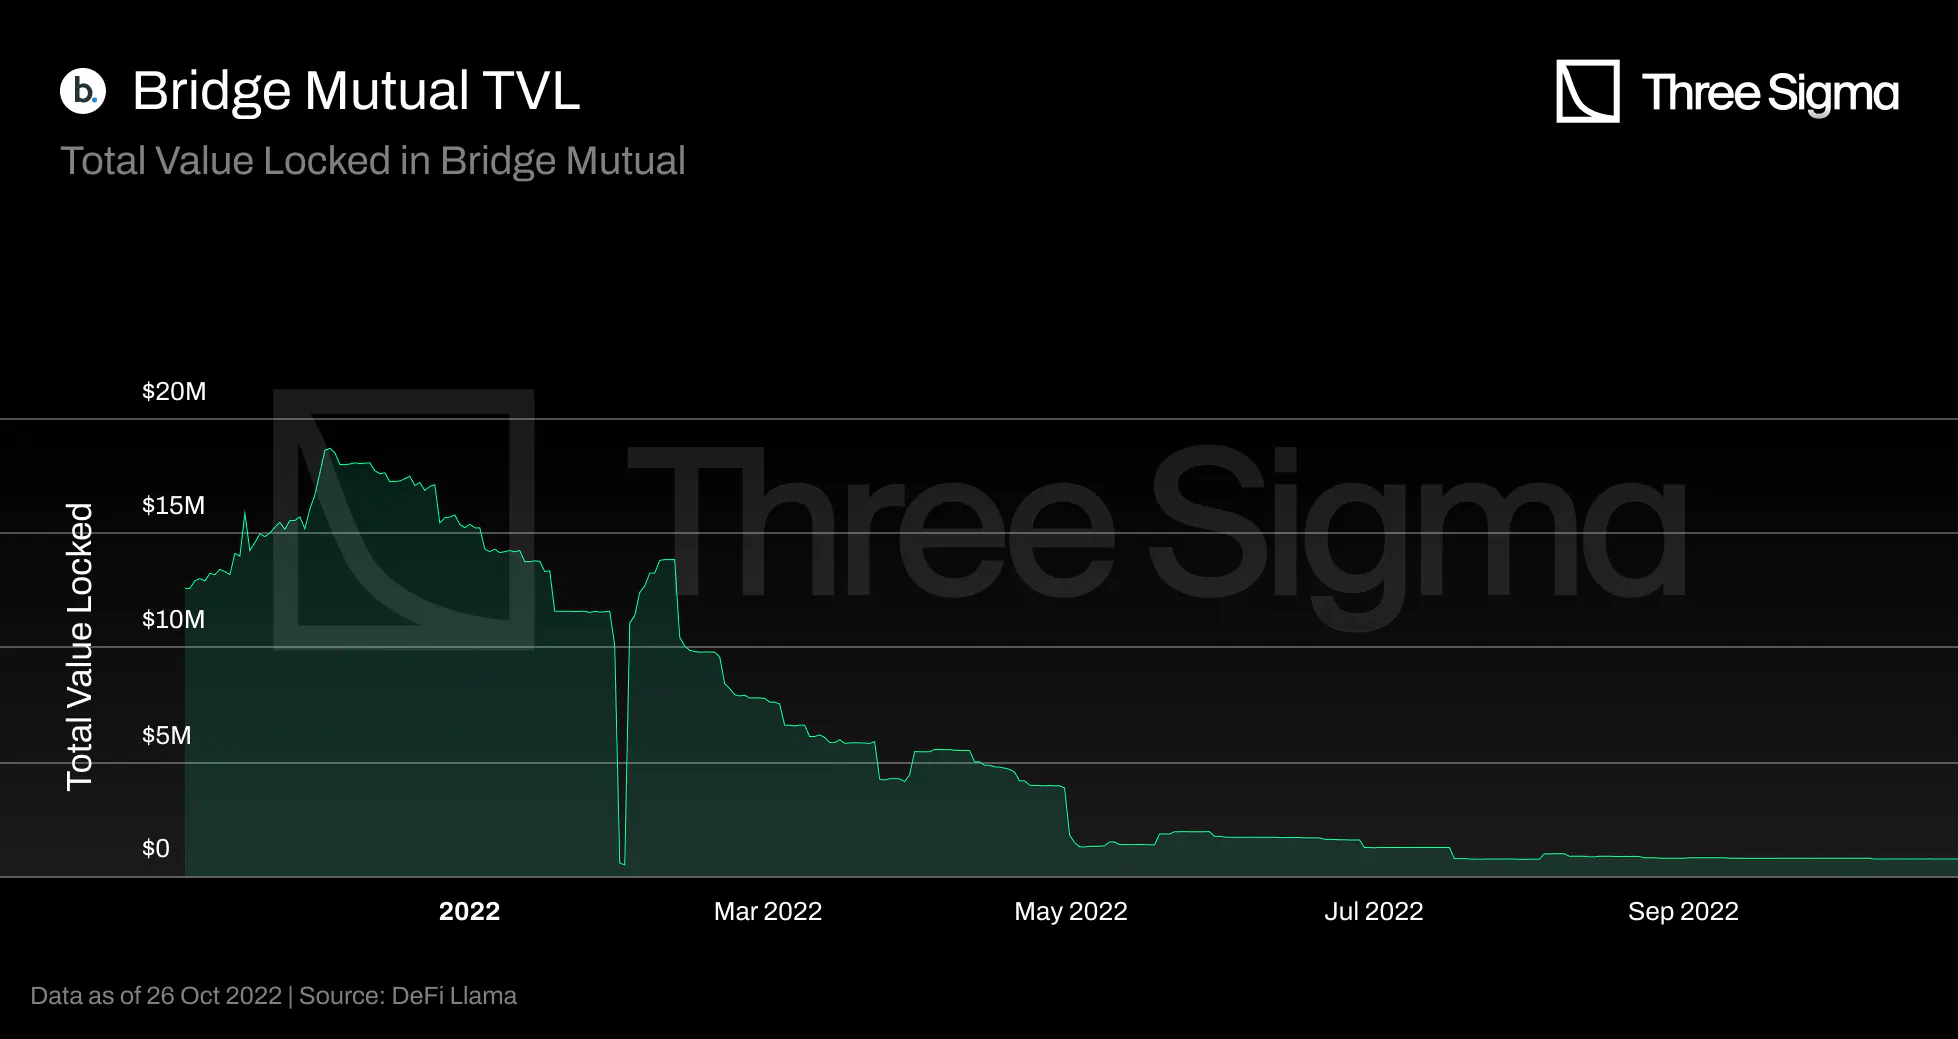
The Total Value Locked of Bridge Mutual grew from \$12.6 million in November 2021 to a peak of \$18.7
million on December 4 2022, an increase by almost 50%. However, since then their TVL has experienced a
95% decline in TVL, dropping to just over $800,000 by the start of October. The V2 was released in
February, and the huge decline and huge increase on the chart were due to a migration of the funds to
the new contracts. No one was forced to unstake their funds, though.
Bridge Mutual was faced with the challenging task of launching a new version during a bear market, when
liquidity in the pools is low and there has been a decline in TVL, as is the case for all protocols
during a bear market.
It is intriguing to note that during the initial days of Bridge Mutual, Nexus's pool value decreased by
over 18M TVL, which may indicate that Bridge Mutual has gained market share at the expense of Nexus. Due
to the fact that the Nexus pool value is composed of ETH and not stable assets such as Bridge Union, it
is difficult to draw conclusions regarding the cause of the decline, since it might just be due to ETH
price volatility.
During the UST Depeg event, Bridge Mutual did not offer Stablecoins Depeg Insurance coverage. No user has
had any policy bought that would reasonably cover any of the events at the time; hence no claims were
made. However, it was offering Anchor insurance and it represented the second most purchased coverage
pool on Bridge Mutual, accounting for 25% of all active coverage on Bridge Mutual. People withdrew money
during this period out of fear of being slashed, and it lost a significant amount of TVL, from \$3.8M to
\$1.3M.
TVC
There is currently no publicly available information regarding the Bridge Mutual protocol's TVC or
similar statistics.
Since there is no current information on the TVC, no conclusion can be drawn.
Revenue
There is currently no publicly available information regarding the Bridge Mutual protocol's revenue
stream or similar statistics.
Since there is no current information on the revenue stream, no conclusion can be drawn.
Final Thoughts
The Reinsurance Pool is an interesting feature of Bridge Mutual, which accumulates yield generated by
investments in the Capital Pool and acts as an internal coverage provider. It de-risks the protocol and
increases capital efficiency. However, it is advertised as not bringing any additional expense for
regular coverage providers, although in other insurance protocols these investment returns would at
least partly go to coverage providers. So effectively coverage providers pay the yield they don’t
receive in exchange for extra safety.
The ability to trade and sell BMI NFT bonds increases the composability with other DeFi protocols, which
increases the value proposition of providing coverage and increasing overall capital efficiency.
The potentially poor user experience that can come from a cover provider not being able to withdraw their
capital from a protocol’s pool could perhaps be mitigated by an incentive structure with focus on small
coverage pools. Without this concern for proper incentivization, it is difficult for users to take
advantage of their ability to create new coverage pools for uncovered protocols.
Regarding risk assessment for premium pricing, there is directly no other evaluation of risk other than
the Utilization ratio, which can not always be a correct measure of risk.
Bright Union
Bright Union is accelerated by Outlier Ventures and is often referred to as the "1inch for Insurance." It
was introduced in September 2021 as a DeFi insurance aggregator that aggregates coverage from multiple
markets, enabling users to compare, find the best option, and purchase coverage in one of the underlying
trusted protocols without leaving the app. Bright Union currently offers coverage for and it is
currently connected to Nexus Mutual, Solace, Unslashed, InsurAce, Ease, Bridge Mutual, among others.
Bright Union only offers coverage and premium services to DAO members.
To address liquidity fragmentation, the Bright Union team is developing a Bright Risk Index, which they
hope will become the industry standard for insurance solutions in DeFi. Bright Union's goal is to create
a centralized point where investors can provide liquidity, which the team can then distribute across
multiple protocols and insurance pools as needed.
The protocol also developed an SDK that enables third-party DeFi applications to easily integrate into
the DeFi insurance world in order to provide these services to their users.
Claim Assessment
Bright Union does not assess claims; the insurance provider is responsible for this process.
Tokenomics
BRIGHT in the utility token of Bright Union. BRIGHT tokens allow holders to share in protocol revenue, as
part of the sales proceeds will be used to buyback BRIGHT tokens from the market. Users who stake tokens
can have voting power and membership access, which enables priority access to products and eligibility
for Bright Union’s premium services (coming soon). Staked tokens are accumulating rewards while being
locked in the protocol. There is a 7 day period to unstake tokens. The value proposition of BRIGHT
tokens seems limited at the moment and sell pressure is expected, as it is not clear how voting power or
membership access will be directly beneficial for the staker and BRIGHT doesn’t have a direct use, e.g.
to buy cover.
Adoption and TVL
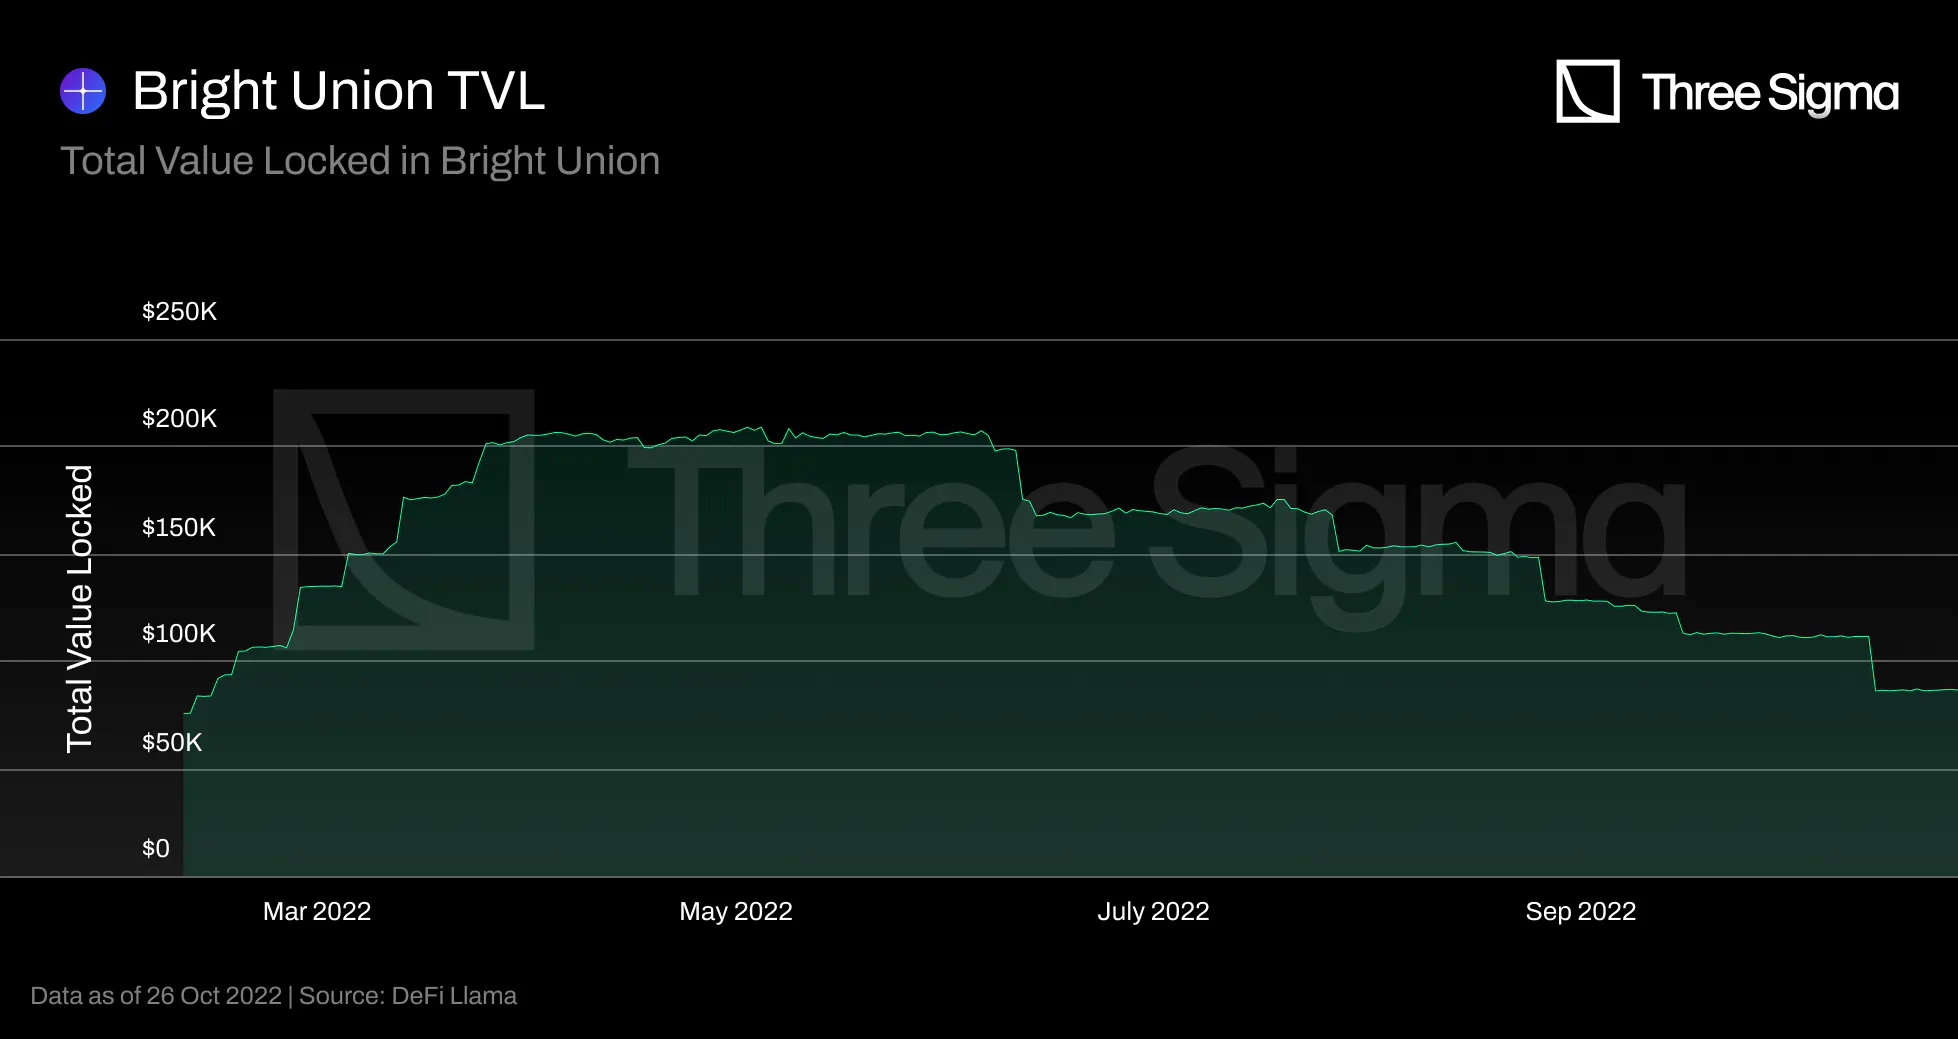
The Total Value Locked (TVL) of Bright Union started at \$76,000 on February 10 2022 and reached a peak
of almost \$208,000 on the 6th of June 2022. Since then, Bright Union’s TVL has been on a steady
decline, with approximately $112,000 in TVL at the start of October 2022. The TVL is related to the
protocol's aggregator nature, as the protocol does not need to own the underlying assets to payout
claims; only the insurance protocols do.
TVC
There is currently no publicly available information regarding the Bright Union protocol's TVC or similar
statistics.
Since there is no current information on the TVC, no conclusion can be drawn.
Revenue
There is currently no publicly available information regarding the Bright Union protocol's revenue stream
or similar statistics.
Since there is no current information on the revenue stream, no conclusion can be drawn.
Final Thoughts
The rapid increase in the number of parties offering these new, complex, decentralized insurance products
presents an opportunity for a single platform to aggregate and match supply and demand. As an
aggregator, Bright Union will be uniquely positioned to give less crypto-savvy individuals with more
varied investment choices via structured products. There seems to be no activity on Discord and we were
not able to get answers from the team, so a deeper analysis was not possible.
Sherlock
Sherlock was released in September 2021 and offers code audits in addition to coverage. The goal of
Sherlock is not to protect users from protocol hacks, but rather to protect protocols from protocol
hacks. With this approach, Sherlock can improve UX by eliminating the need for users to manage their own
coverage for all of the DeFi protocols with which they interact; instead, users can simply use the DeFi
protocol covered by Sherlock and they are automatically covered. Sherlock has a team of blockchain
security engineers who provide code audits for protocols, and any smart contract reviewed as part of an
audit is protected against hacking. In order for a protocol to be covered by Sherlock, it must first
pass a code audit and effectively address all vulnerabilities. Protocols desiring coverage pay monthly
premiums to Sherlock, and in exchange, Sherlock will use its staking pool to refund hacks up to $10
million at covered protocols. When a protocol's coverage expires, it has 7 days to submit claims for
exploits that may have occurred while the coverage was still active. However, once a protocol's coverage
expires, Sherlock is no longer liable for exploits that occur.
The pricing for code audits corresponds to an initial fixed payment based on nSLOC (number of solidity
lines of code) and a prize pool to encourage audit contestants to compete. Moreover, if nSLOC exceeds
6000, this indicates technical complexity of codebases, so Sherlock has the final say on whether or not
to include smart contracts in its audit of protocols. Usually, 50% of the audit cost is paid in advance
to reserve the audit slot, and the remaining amount is paid at the end of the audit in order to receive
the audit report.
Sherlock Participants
The Sherlock ecosystem is composed of three components: Watsons, Protocols, and Capital Providers.
Watsons are security experts who evaluate the protocol's risk based on in-depth fundamental analysis.
Other DeFi Insurance protocols, such as Nexus Mutual, base their risk cost on the capital deposited in
the corresponding protocol’s pool, meaning that the risk is lower when there is more capital in the
pools, under the assumption that LPs conduct due diligence on the protocols prior to staking in the
pool. This method requires that LPs have in-depth knowledge of smart contract security in order to
assess risk, which regular DeFi users do not possess, and causes prices to fluctuate based on the demand
for coverage, which can result in mispriced policies.
Protocols are the ones requiring protection against exploits.
Cover Providers deposit USDC into staking pools for a fixed term of either six or twelve months in
exchange for the risk that up to 50% of their funds could be used to pay out for an exploit at a covered
protocol. This staking position is represented by a NFT that can be redeemed once the lockup period
expires to either unstake or restake the position. Cover Providers are rewarded by receiving premiums
from protocol customers, interest earned from investment strategies like depositing stakers’ funds into
yield strategies, and additional incentive rewards paid in SHER - Sherlock’s governance token. The
amount of SHER distributed will be set by governance. Currently APY is at 14.5% and the team has
informed us that at the moment 100% of all APY sources goes to capital providers right now.
If the LP decides to unstake his position, SHER rewards, the USDC principal, and staking rewards are sent
to the NFT owner's wallet. A further nice feature for these NFTs would be the ability to sell staking
positions on secondary markets, so that users' capital is always available and is not locked up for 6 or
12 months, as well as the capacity to integrate with other NFT-based DeFi protocols.
Cover premiums
The cover premium for each protocol that completes a public audit contest will equal 2% price based on
their TVL and capped based on the maximum amount of coverage that Sherlock can offer ($10M). The cover
premium for each protocol that completes a private audit contest will be 2.25% price. To ensure that a
protocol does not overpay for coverage, the monthly premium is updated based on an off-chain script that
manages the TVL being covered that month. A one-month upfront payment is required to activate coverage,
but it is the protocol's responsibility to manage its payment methods using the Protocol Portal or by
sending funds to Sherlock's multisignature wallet. Payments are made in USDC, and protocols are able to
withdraw funds from their active balance as long as they maintain a minimum amount, which is currently
500 USDC. If the balance falls below that threshold, a bot will automatically, and for a fee, remove
coverage for that protocol. There is always an amount equal to the last seven days of payment that the
protocol cannot withdraw, so that Sherlock can respond if a protocol decides to cancel coverage.
Tokenomics
SHER is the governance token for the Sherlock protocol. Governance functions are planned to increase as
the protocol matures. These will include the management of which Watsons are assigned to which protocols
and other important parameters. Currently it is used as incentive for the stakers and protocols, as well
as compensation to the security team. Without any utility for the token this causes a lot of sell
pressure, so the value of the token is expected to decrease. This is not expected to improve as
governance responsibilities grow and there seems to be no plans to attribute a utility to the token.
Claim Assessment
The claim assessment process is triggered when a protocol covered by Sherlock believes it has been
exploited and submits proof information, such as the block range of the exploit and the amount to be
reimbursed. Most DeFi insurance protocols rely on token holders to decide whether claims should be paid.
Sherlock is utilizing UMA's Data Verification Mechanism (DVM) as the final step in determining claims
payouts to reassure coverage purchasers that they have access to the decision of an impartial party
regarding a claim. Claim assessment in Sherlock is a two-step process based on committee votes and UMA
DVM. After a protocol submits a claim, the Sherlock Protocol Claims Committee (SPCC), which is composed
of Sherlock core team members and security advisors, evaluates the nature of the potential exploit and
maps it to the coverage terms agreed upon with that protocol to determine whether or not it will be
approved. There is no economic incentive to incentivize payouts, so decisions based solely on parties
associated with Sherlock are susceptible to bias. The second step allows the protocol to contest the
SPCC's decision by staking a minimum dollar amount and escalates the claim to the UMA Optimistic Oracle
for an impartial assessment. The DVM mechanism is a game-theoretic decision-making process among UMA
token holders, who will use the information provided by the protocol, the claims committee, and security
experts unaffiliated with Sherlock to determine whether the claim should be paid or not. The decision is
still made by humans (UMA token holders), but outsourcing this step to an impartial third party reduces
bias. In October 2021, this UMA integration went live on the mainnet, allowing for a decentralized,
public, quick, and fair claim process. You can read more about UMA DVM here.
Adoption and TVL
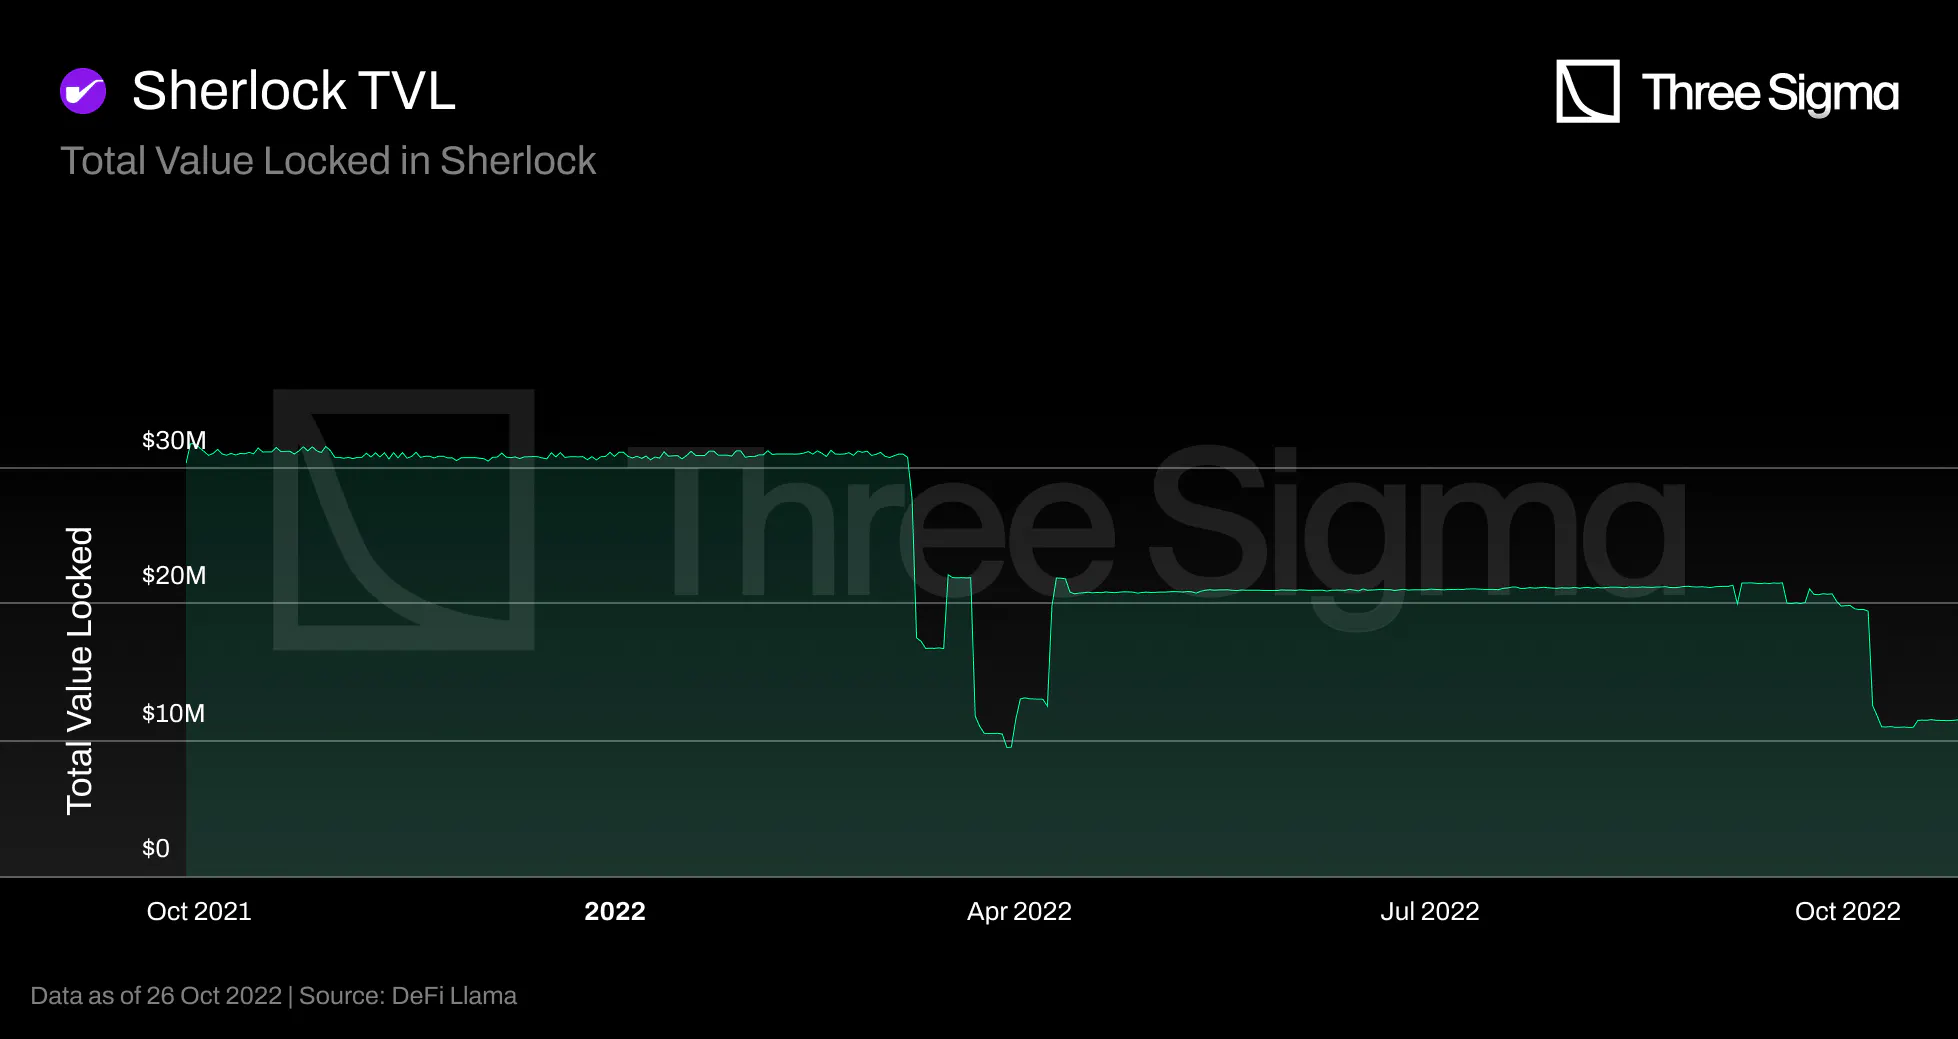
Sherlock's \$30 million guarded launch was bootstrapped through a whitelisted round, pre-seed fundraise,
ensuring liquidity from day one, and was relatively stable, with a \$30 million TVL remaining until
March 7, 2022. This means that Sherlock did not rely on stealing market share from other DeFi insurance
protocols to bootstrap their liquidity at launch. Since then, Sherlock’s TVL has dropped significantly
to a low point of \$9.48 million on 29 March 2022, before slightly recovering to a range of \$20 to \$21
million in TVL from April to the start of October 2022. Staking is set to 6 or 12 month lock up periods,
so that every 6/12 months capital providers can unlock or re-stake their deposits, hence the volatility
in TVL seen in the chart.
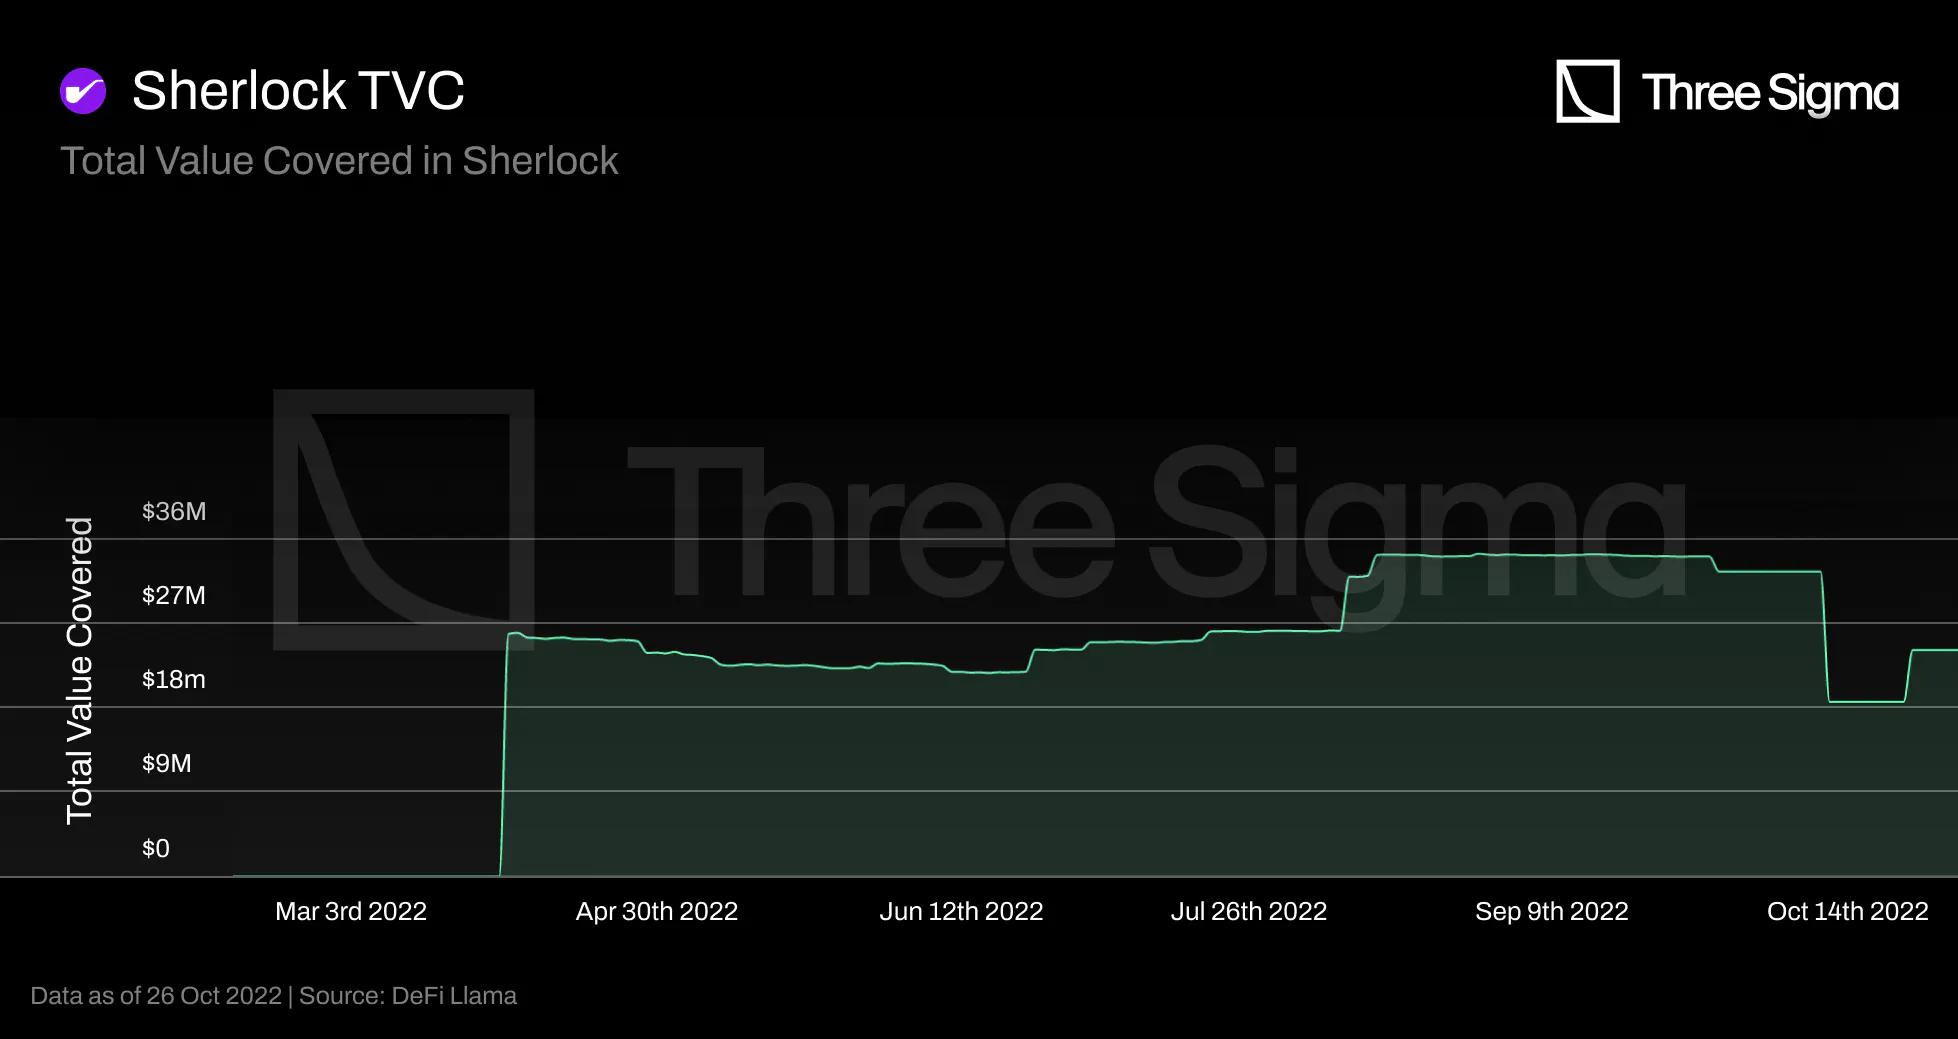
Sherlock was launched in September 2021 but only started covering protocols in April 2022. Sherlock’s
Total Value Covered (TVC) peaked at approximately \$34.9 million on the 25th of August 2022. Since then,
Sherlock’s TVC has been relatively stable and is currently valued at $25 million, with a small decrease
during this month. In general, the rule for the staking pool is that Sherlock cannot offer more than
fifty percent of its TVL to a single protocol. The TVC decreased due to the fact that protocols were
exceeding the 50% capital limit as the staking pool shrank.
Sherlock is currently covering six protocols, such as Squeeth by Opyn (\$7M), Euler (\$7M), Lyra (\$7M),
LiquiFi (\$2.5M), Sentiment (\$500K), and Hook (\$250K). Squeeth by Opyn, Euler, and Lyra comprised more
than 81% of the current TVC, and have less than 20 days of coverage remaining; therefore, the total
value covered will experience a significant decline, as these are the three most valuable protocols
covered by Sherlock.
Nexus Mutual and Sherlock launched Sherlock Excess Cover on October 20, 2022, providing Sherlock coverage
for an additional 25% of their underlying coverage, for a total of 75% coverage. This collaboration will
assist Sherlock in expanding the amount of coverage it can provide to each protocol in the future. The
team is currently not able to cover $10M for each protocol with the current TVL, but expects to be able
to do so again with this partnership and by working to add more TVL to the staking pool.
Revenue
The protocol will charge fees on the premiums paid by protocol teams, but not in the near future, as the
protocol is backed by venture capital and the team believes they can focus on profitability once the
protocol grows. Currently, the revenue is going directly to capital providers. Claims can have a
negative impact on revenue and TVL, but the protocol had no claims as of today.
Since there is no revenue stream, no conclusion can be drawn.
Final Thoughts
Given that code audits require significant time, expertise, resources, and manpower, one of Sherlock's
challenges was scalability, as Sherlock is only able to expand as more protocols are covered, which
requires more code audits prior to providing that coverage. To combat this, Sherlock recently announced
a new code audit contests initiative, through which code auditors can compete to provide audits to
Sherlock for DApps (also known as Watsons) that they wish to underwrite.
Sherlock's theoretical foundation is based on the low probability that multiple maximum payout events
will occur within a short time span and drain the capital pool, leaving protocols without coverage. An
objective quantitative risk analysis could give more security to this foundation. If a large payout
reduces the capital pool by 50%, there will still be sufficient capital in the pool to cover the same
amount of coverage for another protocol. Even though they are aware that the likelihood of the capital
pool being drained by other protocols is extremely low, Sherlock's clients still find the coverage
valuable. While this skin-in-the-game approach reveals confidence in the audits done, in the eventuality
of a large exploit occurring, Sherlock's entire value proposition may be put at risk. Sherlock's code
audits could by proxy lack the same trustworthiness, which could cause stakeholder funds to be removed
from the capital pool, lowering the TVL, and effectively diminishing Sherlock ability to cover more
protocols in the future due to a lack of funds.
Solace
Solace launched on Ethereum in October 19th 2021 with an interface-first approach focusing on ease-of-use
for users. Ever since, it has already launched on Aurora, Fantom and Polygon.
Solace Portfolio Coverage (SPC) allows users to insure all their DeFi positions across multiple protocols
with a single coverage. The concept behind portfolio insurance is that by aggregating risk by protocol
category rather than measuring risk for each protocol, Solace can diversify risk and the total premium
to cover a wallet ends up being less expensive than purchasing cover for each portfolio position.
Even if a user's portfolio positions change, Solace monitors the changes and dynamically adjusts the risk
rate for the portfolio coverage to prevent overpayments and complex policy administration. It provides
cover against re-entry attacks, minting vulnerability, trojan fake tokens, flash loan attacks, math
error, and proxy manipulation.
Solace is developed based on Protocol-Owned Liquidity (POL), a DeFi model directly influenced by the
OlympusDAO model, aiming to separate the conflict of interest that currently exists in
Stakers-As-Underwriters insurance-based model, like Nexus Mutual, during the claiming process. Using the
POL Model, Solace acquires its own underwriting capital to increase capital loyalty and remove the
underwriting risk from token holders.
The bonds program enables users to exchange assets for the SOLACE native token, which can be staked to
earn rewards. Users can participate in underwriting by providing capital but without the risk of
financial loss in the event of an exploit, and earn returns from policy sales and token emissions.
Solace, unlike its competitors who leverage stakers' liquidity for policy sales, places the assets from
the bond program in the Underwriting Pool to sell policies against. This pool is used to payout claims,
and because the protocol manages the underwriting pool, stakers do not lose their locked $SOLACE if a
hack occurs.
Cover Pricing
SPC uses a pay-as-you-go model that charges users based on the risk score of their portfolio. The premium
can be calculated on a daily, weekly, or annual basis and is proportional to the risk and positions of
the user's portfolio, ensuring that users do not overpay for insurance and only pay for the cover they
really use.
Regular payments are an appealing feature for L2s because they provide near-zero gas fees. Users
purchasing coverage on the mainnet should be prepared to experience Ethereum high fees once transaction
volume increases again, so annual payments may make more sense in this case.
Risk Assessment
The protocols covered are limited to the list of protocols in Zapper's API since the Risk Rating Engine
utilizes Zapper's API to obtain protocol information and a wallet's protocol positions.
Solace's risk cost is based on four risk levels. The fee for a position is proportional to its inherent
risk.
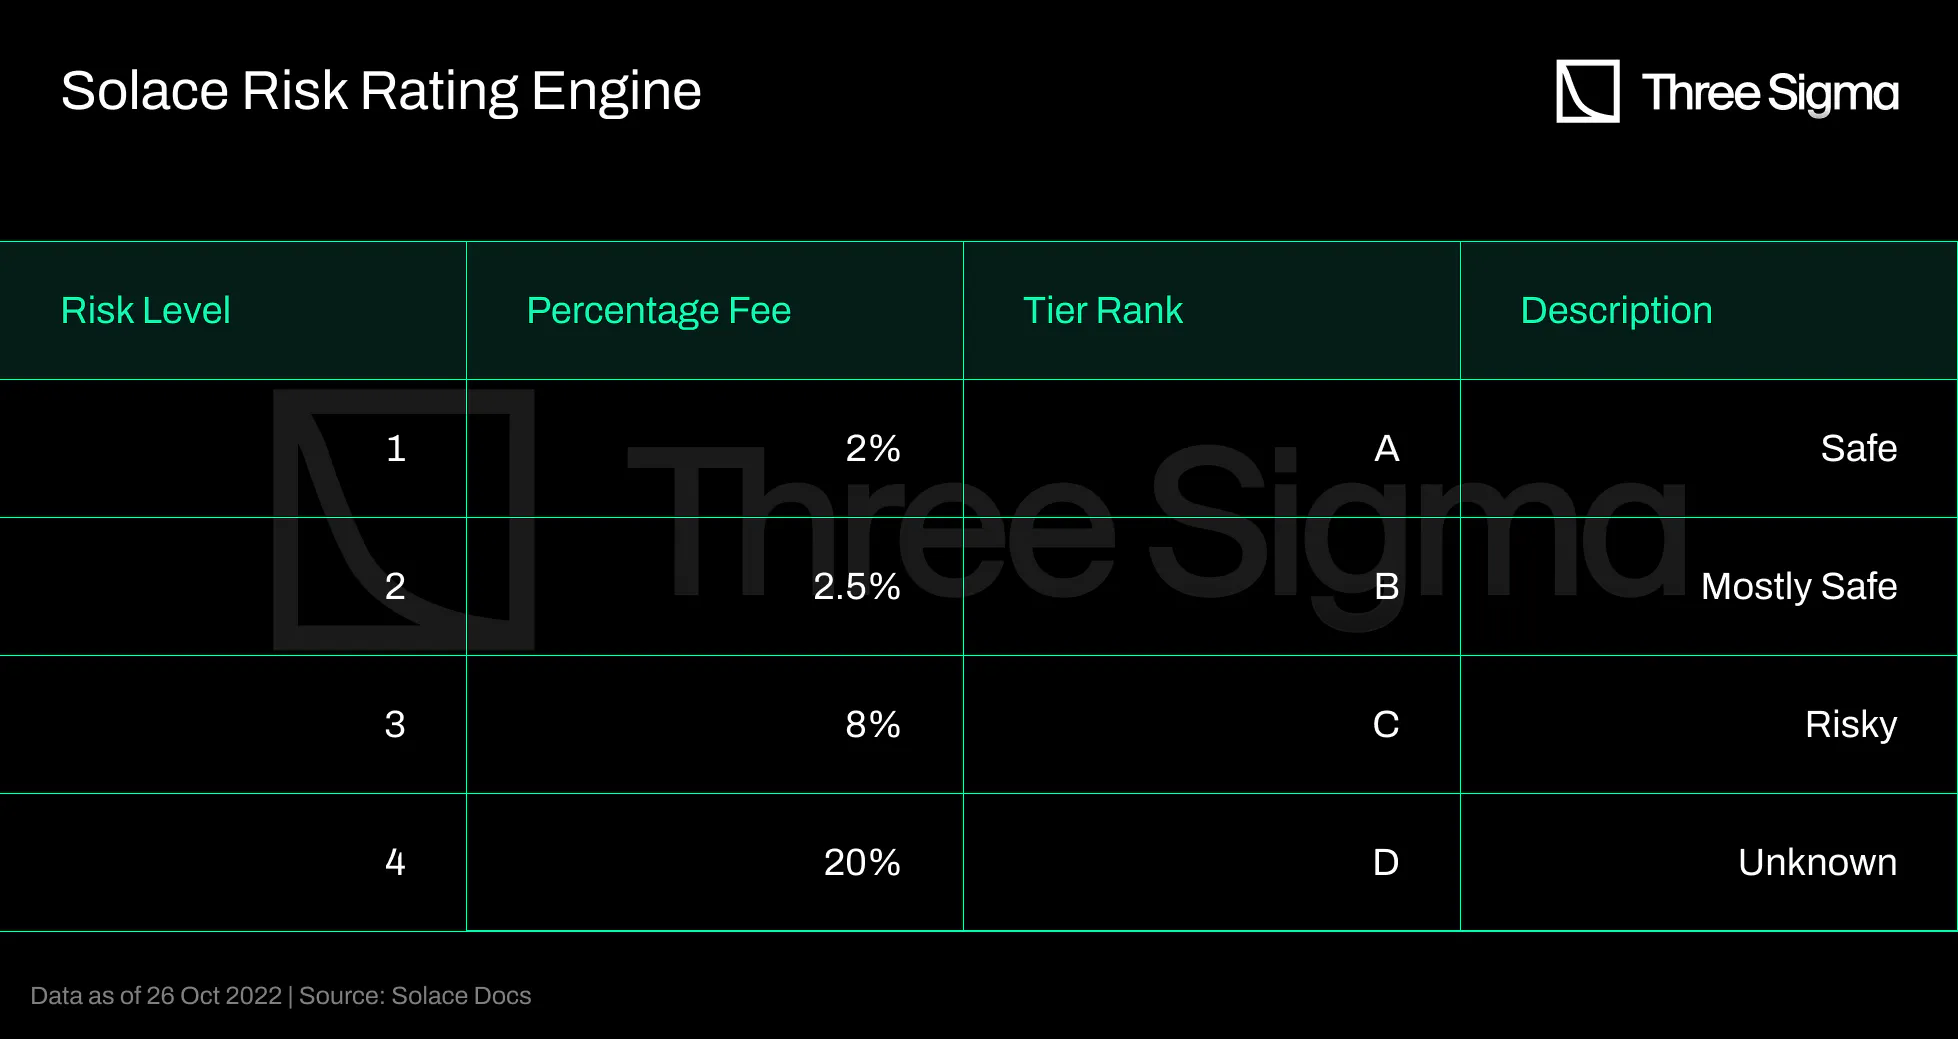
Solace was initially relying on the professional judgment of its risk management team, but currently each
protocol is evaluated based on an algorithm that utilizes data from the Zapper API relating to current
hacks/exploits and public information on protocols. Solace calculates the Risk Rate for the User
Portfolio based on the following data for each protocol: Total Value Locked, Blockchain Network, Number
of Users, Transaction Activity, Time Since Launch and Number of Audits.
This data is currently retrieved from DeFi Llama, Defiyield, Rekt News and CryptoSec. Each attribute has
its own weight coefficient in the estimation of the total risk. Currently, weights are determined by the
team, but governance will take over as more reliable data is aggregated. The algorithm generates a score
based on the information available on the protocol, but the risk management team can modify it if it
does not agree with the output. This occurred with Aave V3, for instance, because the smart contracts
were brand-new and the algorithm assigned it a high risk rating. It gives the team the ability to change
the output score if it disagrees with its value, but it also introduces a centralization point that
requires trust in the risk management team not to manipulate the result when it is convenient.
Nonetheless, in addition to evaluating each protocol, it is essential to comprehend the impact of DeFi
category differences. DeFi projects may interact with each other, and hacking one project may have a
significant impact on the others. Solace calculates the Inter-Category and Category Internal Correlation
Tables based on statistical approaches that account for possible explicit and implicit risk connections
between various DeFi categories (like lending, AMM, DEX, Derivative) and protocols.
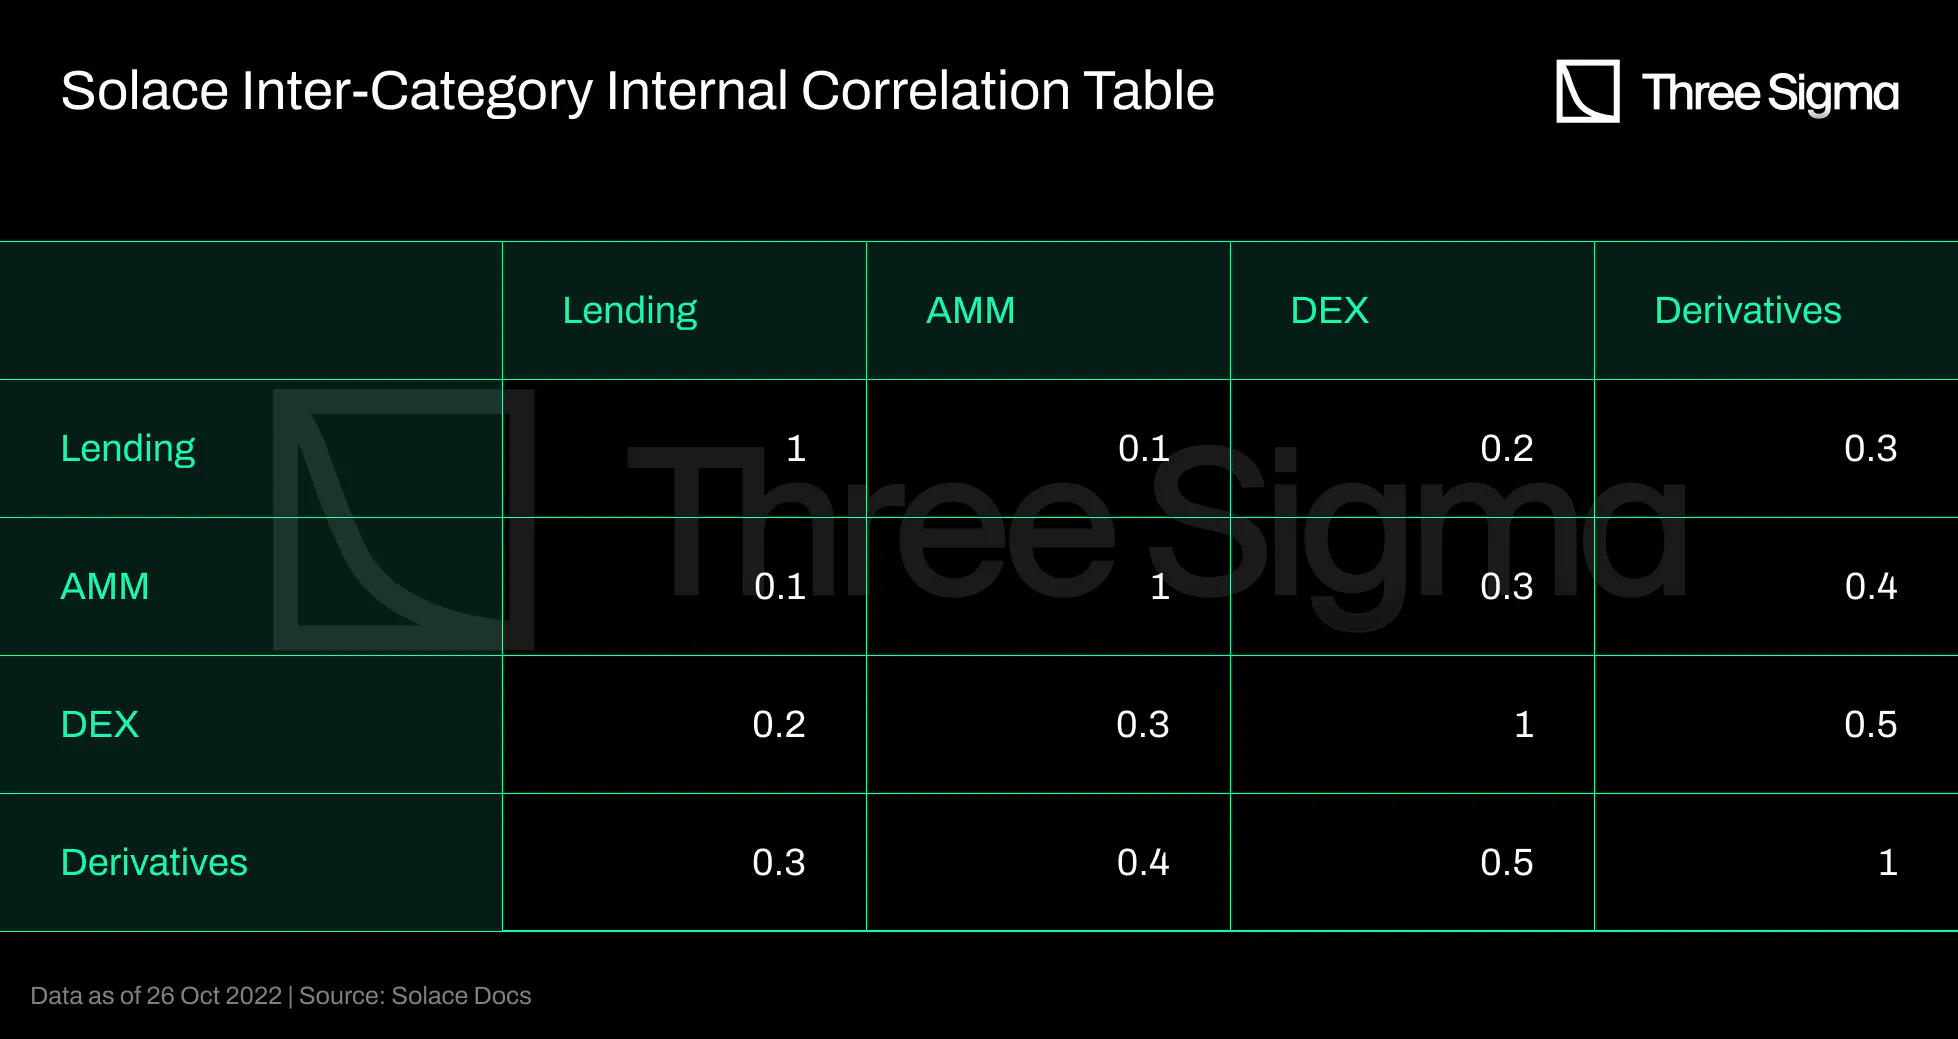
The table presented above represents the Inter-Category relationships and is populated by experts based
on their experience and research. The greater the value in this table, the greater the correlation
between the categories.
Although this risk framework seems to present a transparent and thorough review of a portfolio's risk,
there are some assumptions that will influence the rating heavily. The category in which a protocol is
categorized in for instance, will have a big influence especially through the Inter-Category
relationships. Albeit in many cases this is an obvious categorization, in other cases not. The fact that
Inter-Category relationships are analyzed in such a broad way will naturally mean there is an averaging
of the correlations. For example a lending protocol can globally have little to do with a AMMs
(correlation of 0.1), but there may be two particular protocols in a portfolio belonging to these
categories that have something crucial in common that influence each other, e.g., an LP token that is
accepted as collateral is a pool in the AMM. There could perhaps be other tables such as this one that
evaluate correlation in terms of other metrics that are not in the category they belong to. Another
example would be protocols run by the same team, where a team member is revealed to be a bad actor.
To mitigate this, there is a Category Internal Correlation Table that has a similar output as the
previous table but within the same category, and is also populated by experts within the Solace team.
This does not cover the possible cross category correlations mentioned above, but it is definitely a
step in the right direction. This table shows the probability that there could be a negative impact on
product B if product A is hacked. Currently the team is attributing low correlation values to all
product pairs. The team recognizes that this is an assumption and that this coefficient should be
calculated by their rating engine.
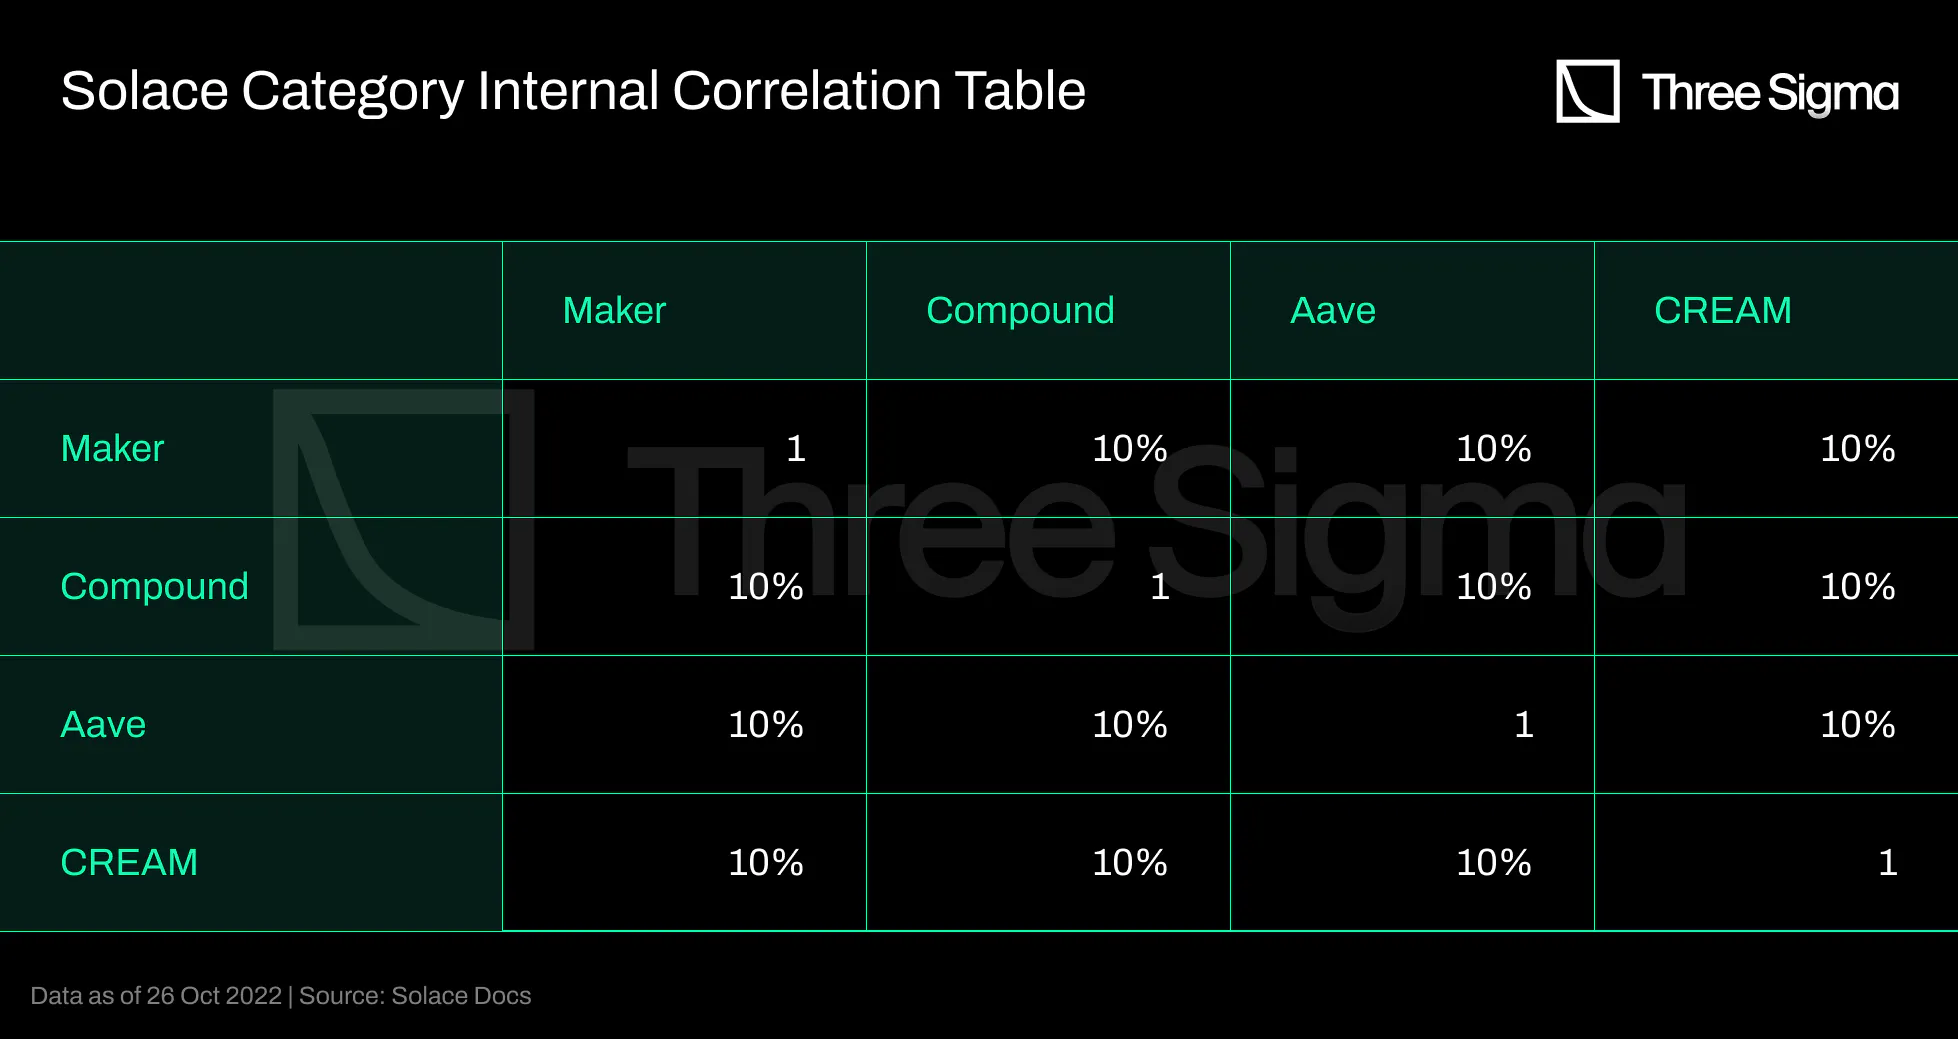
The Solace team estimates that by aggregating risk loads by category, they are able to diversify the risk
load so that the total premium ends up being cheaper at a discount of between 10 and 20%. Deriving these
values is not trivial and a transparent calculation of this estimate would be interesting to see.
However, it is feasible that the isolated risk calculations to arrive at each premium would have to be
more conservative as there would be no other risks to balance out the need for a pay out.
The risk rates are not disclosed on-chain, but they can be accessed at
https://risk-data.solace.fi/series. Each week, the risk management team updates the series data to
reflect the most recent Zapper integrations.
Tokenomics
To pay out claims, Solace uses an underwriting pool, from which it will take money to cover a hacked
protocol. Like described above, this pool is funded with SOLACE bonds from users who want to provide
their assets in return for yield from staking. In general, the motivation for a user to purchase this
bond by sending assets into the Underwriting pool would be to get SOLACE at a discount. In this case the
user receives SOLACE at a 20% discount. However, SOLACE doesn’t have a practical utility at least for
now, and so it will have sell pressure nevertheless. Buying at a discount is not particularly useful if
the value of the token is expected to decrease as users sell their rewards.
Claim Assessment
An exploit is detected via a DAO vote to pay out insurers with a position that experienced a hack. Solace
does not want the DAO to undertake the claim assessment because the team is aware of the inherent
conflict of interest. It had intended to implement a Parametric Automated Claims Assessment System
(PACLAS) that will quantify a loss event using on-chain data and invariants, but it is now transitioning
to a Kleros-based claim assessment. The team will provide additional information on this topic in the
coming months.
Adoption and TVL
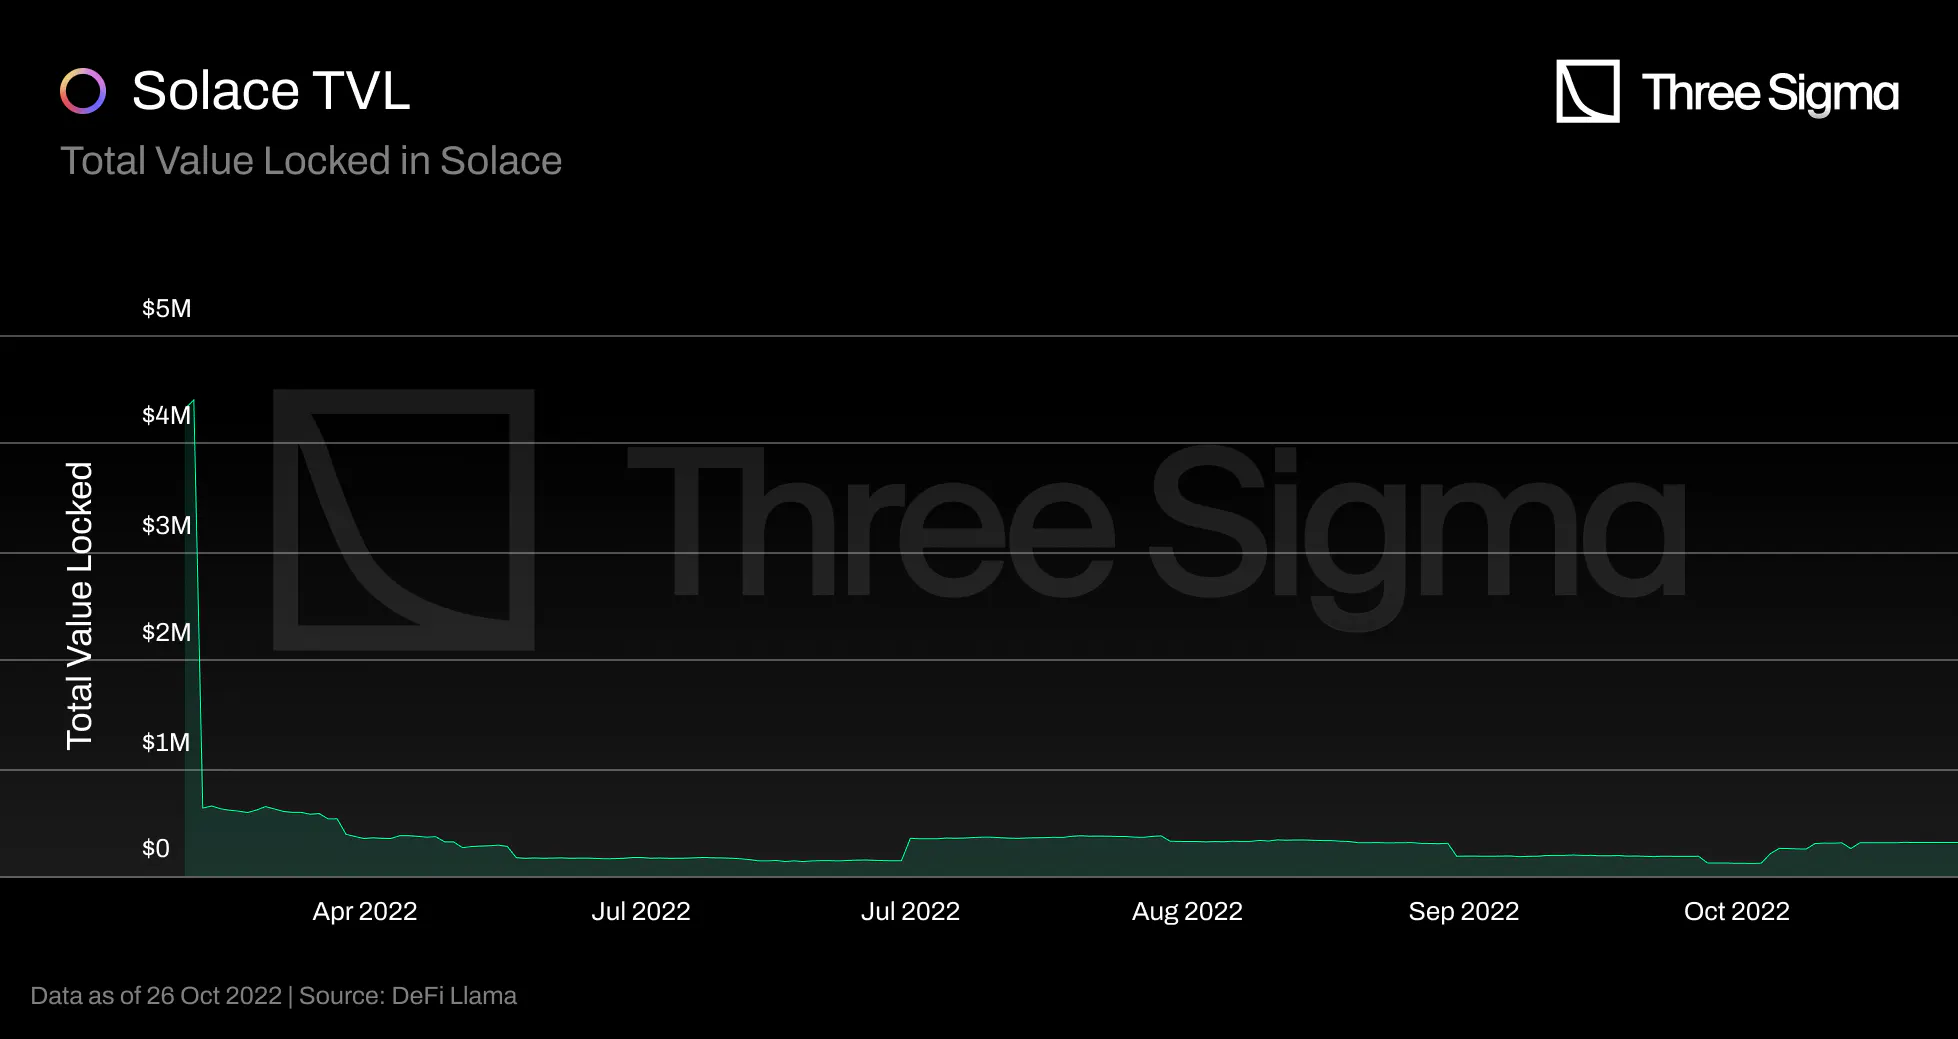
TVL dropped dramatically, from \$4 million to values below $1 million. This sharp reduction in TVL was
primarily due to DeFi Llama integration, since the team was asked to remove some asset sources. The TVL
is composed solely by solace/usdc pool and staking. There are also macroeconomic conditions to consider,
as April was a month in which a significant amount of liquidity was taken from the crypto economy.
Ethereum has the largest number of underwriting pools with 253K, followed by Aurora, Polygon, and Fantom.
No claims were ever paid because no user ever experienced a hack on the covered protocols, so claim
payouts had no negative impact on the TVL.
TVC
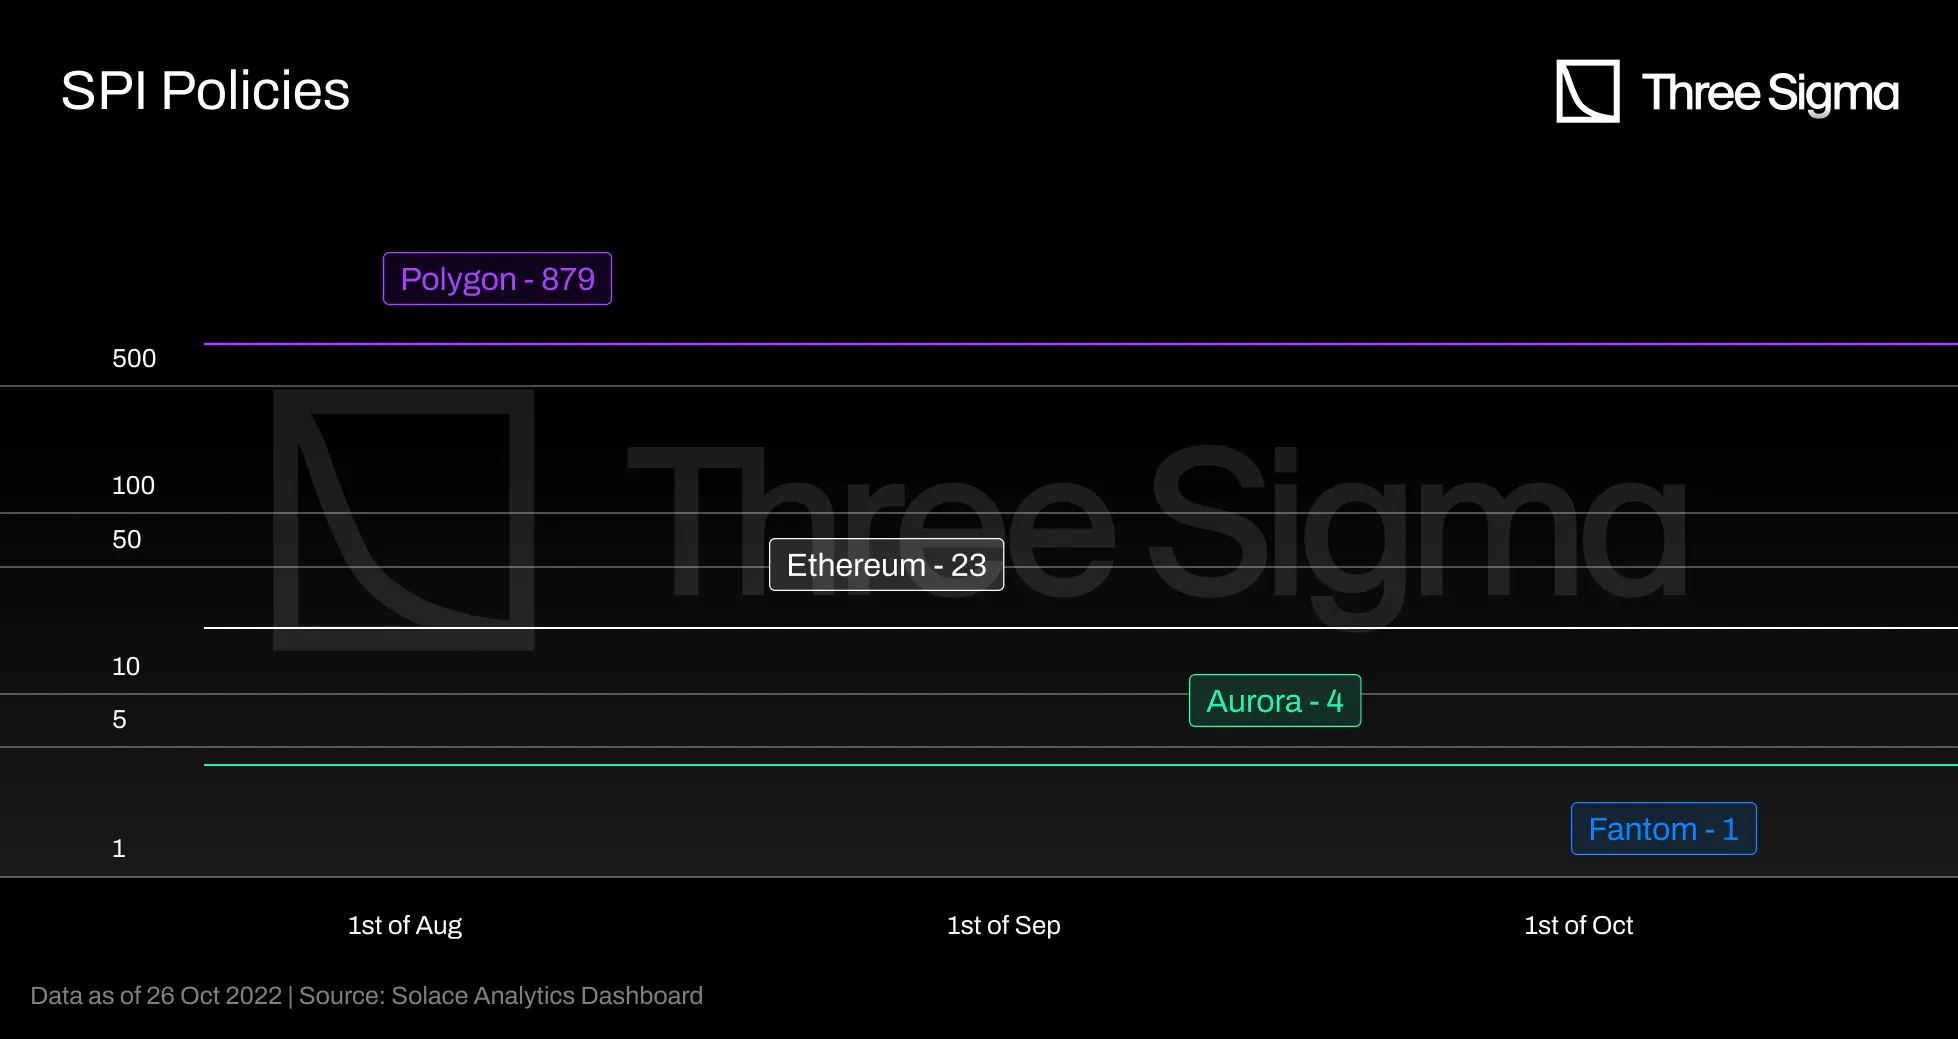
Currently, there are 875 active covers. The chart shows that most policies are purchased for protocols
deployed on Polygon, followed by protocols on Ethereum. In the last 30 days, only two claims were sold,
while seven claims were sold in the last 60 days. Solace is still building and improving its system by,
for example, decentralizing its claim assessment to avoid conflicts of interest, so its growth is still
extremely slow.
There is currently a safety mechanism to ensure that the total amount of coverage is always less than the
underwriting Pool's capital in the Underwriting Pool to avoid insolvency. As the probability of all
positions being exploited decreases with increased underwriting capital, Solace intends to modify this
as it expands.
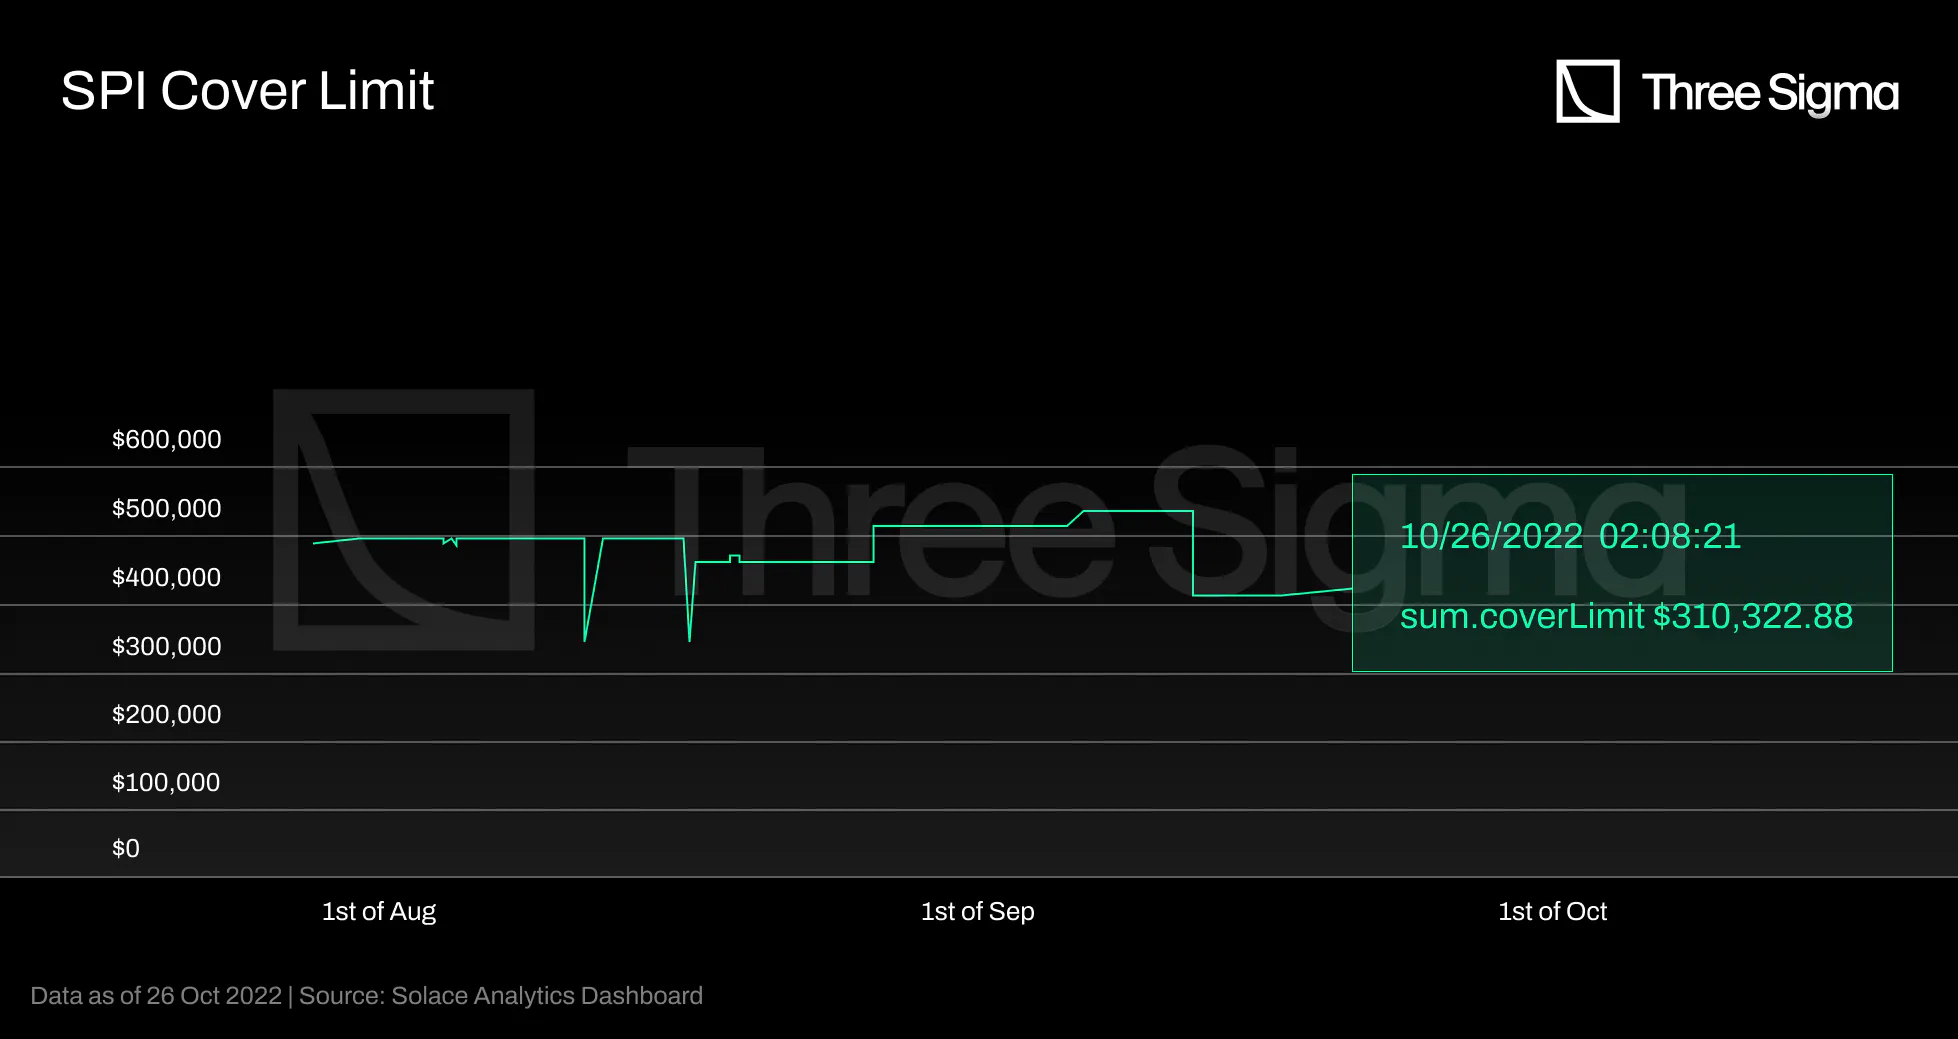
The current underwriting pool value is 312K, and the current Cover Limit is 310K. This is part of the
security mechanism mentioned above. Thus, if the amount of coverage approaches the reserve's capacity,
the protocol prohibits the sale of policies.
Revenue
Currently, the revenue from the underwriting activity flows mostly to staked SOLACE, with a small fee
distributed to risk strategists, risk managers. The protocol takes 5% of all bonds to the DAO to pay
back to contributors and core teams. Premium prices range from 2-8% of the investment per year. As
Solace scales up the architecture, a small fee will be distributed to the DAO treasury.
As a staking incentive, Solace was previously rewarding 10M SOLACE per chain; however, the incentive has
been changed to 10M SOLACE per year for all four chains. Since Solace is heavily dependent on the
concept of SOLACE rewards to incentivize staking, this inflates the token supply without generating
intrinsic value, and the Solace team must be careful not to spend more on rewards than the insurance
policies are generating in revenue.
There is no public information on Revenue values, so no conclusion can be drawn.
Final Thoughts
The inflationary mechanisms of SOLACE present a disadvantage for this model. There is a growing consensus
that staking alone is a poor design for a token model. It inflates the token supply because it does not
generate intrinsic value, and if left unchecked, the token price may fall to compensate for the new
supply. As investors in DeFi 2.0 may recall during the “(3,3) season”, this model was not particularly
effective. Plans are already in place to increase utility by accepting SOLACE as a method of coverage
payment.
However, the idea of using bonds to acquire protocol owned liquidity, effectively taking risk from users
is very interesting. In terms of risk management for Solace, this has the great advantage of users not
withdrawing value from the underwriting pool. The pool size doesn’t dynamically change when users
deposit and withdraw, it is ever-growing unless there are claims to be paid out. Naturally the total
value in the underwriting pool is still volatile, depending on the assets that are held by the protocol,
but this makes it simpler to guarantee that there always are necessary funds to pay all obligations.
Steady State
As of October 2022, Steady State is not yet live. Currently in development, the Steady State protocol
will be ruled by in-depth quantitative data analysis and complex risk modeling, delivered via automated
smart contracts and supported by a governance DAO and a fully liquid secondary market. Using smart
contracts to implement this solution will remove bias, increase efficiency and speed, and ensure
immutable claims processing.
Coverage pools represent the insurance collateral for any given protocol or platform, allowing DeFi
protocols and centralized finance (CeFi) platforms to tailor an insurance policy to their specific
needs. Multiple protocols can join forces to create index pools in addition to the standard coverage
pools. Index pools will provide greater collateralization and lower policy costs for protocols, while
reducing the risk for capital providers.
Steady State hopes to automate and make transparent their claims process by integrating with Chainlink
Automation, which enables the conditional execution of smart contract functions that evaluate
transaction data, relevant addresses, and oracle price feeds to determine when a covered event has
occurred.
The team has been developing the Risk Analysis Database (RAD) to preserve crypto data transparency
standards and generate machine-learning-based rating for DeFi protocols. The primary function of the RAD
is to collect information on DeFi attacks against protocols and will be available to all parties,
including other DeFi insurance platforms. The collected data is segmented and partitioned across
datasets that identify the type of risk event, the date, the USD value lost, the protocol type, and the
duration of the protocol's operation. This data can be processed by machine learning algorithms to
identify risk factors and generate more precise risk ratings. The same idea is behind InsurAce risk
models. Their last announced collaboration will allow Steady State to explore Flourishing Capital’s
proprietary AI technology in developing their own RAD.
The Steady State insurance product is not live, it has not even been deployed on testnet, and the results
of their sophisticated and automated risk model have not been disclosed. The product attempts to address
the current bottlenecks in decentralized insurance, but it is difficult to predict its success without
seeing the market's reaction and with so little information available.
An opinion on the current DeFi Insurance Landscape
There are few insurance protocols in the DeFi ecosystem, and there needs to be more TVL locked insured to
increase the secured value in DeFi.
DeFi valid claims are relatively rare but extremely severe in terms of value. According to Chainalysis,
at least \$718 million had been stolen in October alone across 11 different hacks, bringing the annual
value to over $3 billion across 125 hacks. This puts 2022 on track to set a record for the overall
amount of value stolen in the crypto space.
It's ironic, but some insurance protocols were also hacked in the past, like the Cover protocol in
December 2020. Cover experienced an exploit in one of their smart contracts that contained an infinite
mint vulnerability, causing the total supply of tokens to grow by 48 quadrillion percent. The project
chose to shut down almost a year later, in September 2021, because the TVL plunged after the attack, and
the protocol never restored LPs' faith. TVL is critical for an insurance protocol because it determines
the capacity limit to sell new cover policies. Thus, with limited TVL, protocols can hardly fulfill
their value proposition and become useless.
At the time of the hack, Cover had \$45 million in TVL and was the second largest insurance protocol by
TVL, following only Nexus, which had $100 million. At the time, insurers accounted for approximately
0.6% of the TVL in DeFi, highlighting the enormous possibility of securing digital assets.
As previously described, existing insurance protocols also fail to attract liquidity following the Terra
collapse and the current macro situation.
Nexus launched in 2019 with a Stakers as Underwriter's business model, KYC requirements, and smart
contract coverage on a single protocol. It is still the most significant player in terms of TVL.
Following that, many protocols have attempted to innovate and address specific DeFi Insurance
challenges, such as risk assessment, cover pricing, fragmented liquidity, asset management, and claim
assessment.
The first approach to risk assessment was to associate risk with the value supplied by capital providers
to each pool (each corresponding to a protocol). This idea assumes that more value staked represents
fewer risks and relies on stakers conducting their due diligence before providing capital to the pools.
This requires a level of security expertise and financial risk that most DeFi users lack. Bridge Mutual
proposed a novel approach to determining the risk cost based on utilization ratios. A high utilization
ratio indicates that many users are willing to purchase insurance for that project, but few are willing
to provide coverage, implying that the project is risky. However, because these pools charge higher
premiums and thus have a higher APY, the utilization ratio may fall, which makes this metric no longer
reflect a perceived risk but rather a high-yield opportunity. Later, Ease proposed a different approach
in which users can share risk among themselves at the cost of not being fully reimbursed during an
exploit. In this approach, the protocol team performs due diligence on a protocol before adding a vault,
representing a centralized action.
Risk assessment is extremely difficult to decentralize and should ideally become automated solely based
on data. It is not easy to achieve this; Steady State is attempting to develop an algorithm, but the
lack of information on-chain remains a barrier to training precise machine learning models to predict
the correct risk cost per asset class. InsurAce also uses machine learning models to calculate
traditional actuarial loss functions, but these calculations are kept off-chain and are not verifiable.
In terms of coverage pricing, Nexus began with a basic version of pricing coverage proportional to the
risk cost for the protocol, the coverage amount, and the coverage duration. Pools with higher value
staked must charge a lower premium because they are considered safer. However, the incentives for
capital providers to invest in a specific pool are tightly linked to the APY they expect to receive,
which may cloud their risk assessment judgment. As a result, the question arises as to whether the value
staked against a specific protocol is sufficient for measuring risk when used as the sole metric. Later,
InsurAce proposed dynamically pricing coverage based on supply and demand, using machine learning models
to estimate parameters typically used in traditional insurance. However, available data seems very
limited to employ these models. Later, Armor and Solace both implemented a pay-as-you-go model. Armor
was receiving premium payments by block, but the team decided to discontinue this feature due to
Ethereum's high fees for its users. On Solace, the user can choose their payment period - daily,
monthly, or annually - but users who choose a shorter period will most likely face higher fees. Risk
Harbor is taking a very innovative approach by defining the price based on an AMM model. However, no
information could be found regarding how the default occurrence probability needed for the risk cost is
obtained nor how the risk cost is integrated into the cover pricing, so it isn't easy to analyse if it's
viable.
Cover pricing is an area for improvement in the DeFi insurance space as it would ideally be
decentralized, automated, and capable of providing the appropriate cover premium based on entirely
traceable on-chain information. Models like this face the same challenges that automated risk cost
assessment does.
Nexus' single-protocol coverage insurance had fragmented liquidity and lacked capital efficiency.
InsurAce quickly improved this by introducing portfolio-based coverage insurance, and Ease developed a
mechanism allowing several vaults to share risk.
DeFi Insurance protocols, just like traditional insurance companies, develop investment strategies to
manage their capital more efficiently, generate additional revenue to avoid insolvency, and reward
capital providers with higher returns. However, asset management is a sensitive topic in DeFi because it
is a double-edged sword: DAOs are not solely composed of asset management experts, and the community
will not feel comfortable with a centralized investment approach. Most protocols have an investment arm
that proposes investment strategies, but the DAO must approve the proposal. Furthermore, while
investments bring clear benefits for the stakeholders, they also add risk, which is what users are
trying to mitigate by purchasing insurance.
Finally, most DeFi Insurance protocols, such as Nexus, InsurAce, and Bridge Mutual, rely on a biased
claim assessment process based on the idea that stakers should vote on whether or not to pay a claim. If
a large event occurs in the underwriter model, the underwriters are incentivized to vote against
policyholders because their profits are now at risk. This is an apparent conflict of interest situation,
and Unslashed was the first protocol to decentralize the claim assessment process to Kleros, although a
human must still submit the claim. Risk Harbor has implemented an automated claim evaluation procedure
that monitors the evolution of public system state variables directly on-chain to determine if a claim
should be paid out. The disadvantages of this method is that consumers must still make the claim, and
the automation can only be implemented for parametric insurances in which all parameters are predefined.
However, the process is impartial, scalable, and far quicker than governance-based assessments. With
Ease the need for claims disappears through their creative use of reciprocally-covered assets.
An exploit detection should ideally be automatically triggered, and claim payout should be executed via
smart contracts. Steady State is attempting to accomplish this by integrating with Chainlink Automation,
but there is still little information available, and the protocol is still not operational. An exploit
oracle could be a solution by serving as a source of truth for all DeFi protocols and users regarding
whether or not an exploit occurred, which contracts were exploited, the assets affected, and the
correspondent wallet addresses.
An insurance company should be able to remain healthy as long as it effectively prices risk, resulting in
high premium revenue and low payouts. When this risk is not effectively measured, an insurance company
may face significant insolvency risks if large payouts occur at the same time. Insurance is used to
avoid insolvency in the event of a large exploit. However, the majority of the investment strategies
that insurance protocols use are DeFi-based, exposing users to the same kind of protocol risk that they
are supposedly shielding them from. Market volatility is another factor to consider in these
investments. Nexus Mutual, for example, is currently losing money due to poor investment returns. The
Terra Collapse had a significant impact on protocol TVL, with protocols fighting for their lives long
after it happened. Ease is dealing with this by not fully reimbursing the user, which means that in the
event of an attack, the likelihood of not receiving any funds is extremely low. Protocols developing
investment strategies risk running out of funds to pay out claims to everyone, which means that some
users may not receive any compensation. Better security mechanisms are required to ensure sufficient
funds in insurance pools.
Nexus Mutual remains the industry leader in DeFi Insurance. Having been the first kid on the block in the
decentralized insurance space, it still enjoys a first mover advantage. We highlighted that numerous
obstacles must be addressed for an insurance protocol to bring innovation and succeed. Whichever
decentralized insurance protocol earns market trust and market share by enabling scalable underwriting
without fragmented liquidity, transparent and decentralized risk assessment and premium pricing, and
continuous payout of valid claims will become the market leader in this sector. We are looking to help
protocols achieve this goal, to ultimately help boost DeFi adoption. If you are working on any existing
challenges in the DeFi Insurance space, we would like to hear from you.
Please get in touch with us at info@threesigma.xyz.
✢